move the mouse pointer over that image.
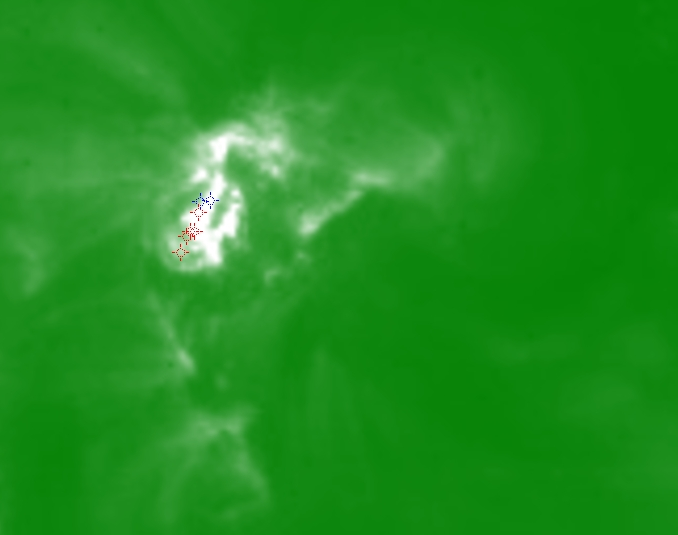
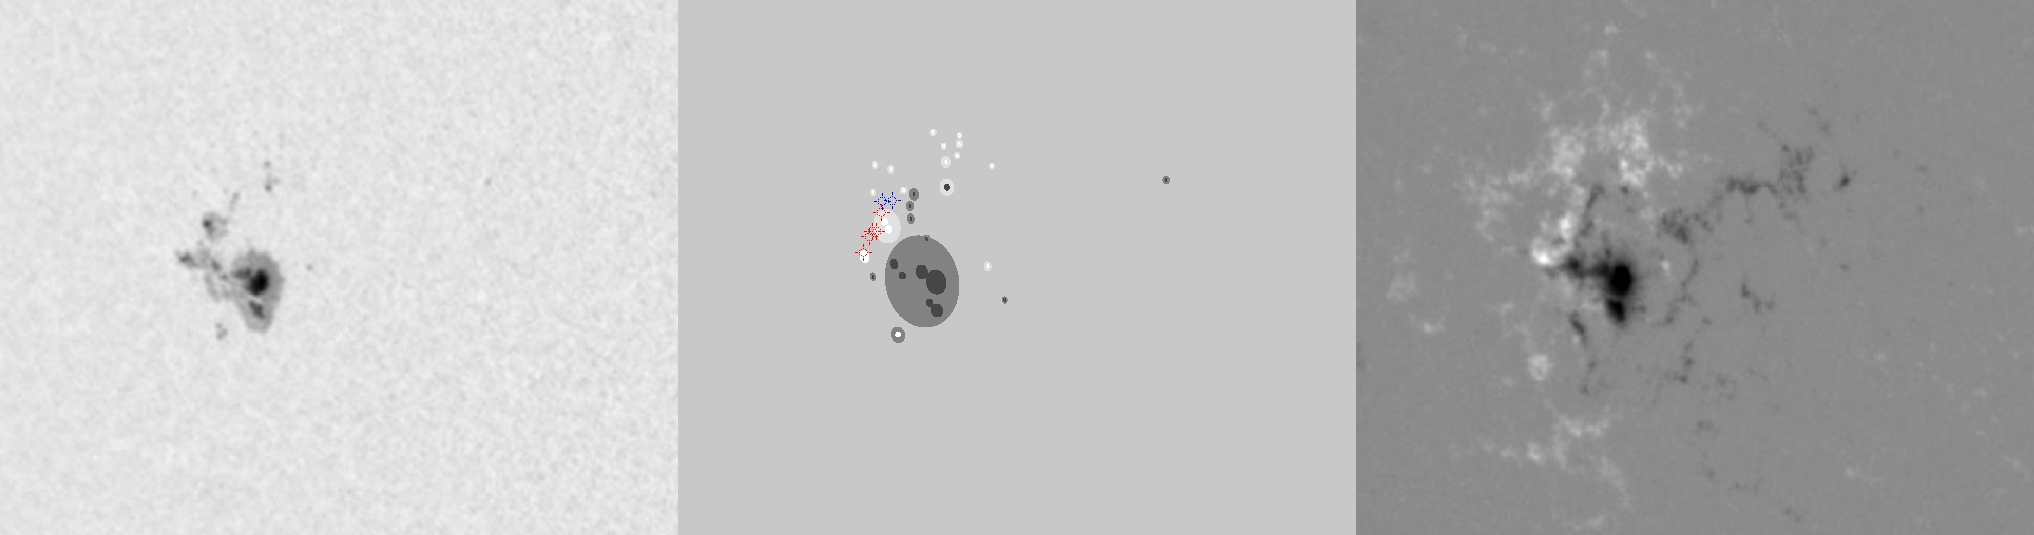
| Evolution of sunspot group NOAA 10875 and positions of flares in it animated by using the data of SOHO/MDI Debrecen Data (SDD) sunspot catalogue (lower panel, middle, ellipses with positions and areas corresponding to the relevant data of spots in SDD and with grey-scale colour coding of the magnetic polarities corresponding to that of the magnetograms), SOHO/MDI continuum images (lower panel, left) and magnetograms (lower panel, right), SOHO/EIT images (upper panel, middle), GOES and RHESSI flare data (red and blue symbols) observed within the interval around the time of SDD data. |
|
When you want to zoom in on one of the images, simply move the mouse pointer over that image. |
 |
| Year | Month | Day | Hour | Min | Sec | NOAA | Proj.U | Proj.WS | Corr.U | Corr.WS | B | L | LCM | Pos.angle | r | MU | MP |
|---|---|---|---|---|---|---|---|---|---|---|---|---|---|---|---|---|---|
| 2006 | 04 | 26 | 14 | 23 | 31 | 10875 | 120 | 939 | 75 | 593 | -10.51 | 114.78 | -38.23 | 101.16 | 0.6226 | -920.9 | -281.7 |
| Flare | Date | Start | Peak | End | Dur [s] | Peak [c/s] | Total Counts | Energy [keV] | X pos [asec] | Y pos [asec] | Radial [asec] | B [deg] | L [deg] | Flags |
|---|---|---|---|---|---|---|---|---|---|---|---|---|---|---|
| 6042656 | 26-Apr-2006 | 13:34:48 | 13:37:58 | 13:38:28 | 220 | 400 | 100272 | 6-12 | -617 | -105 | 626 | -9.86 | 111.64 | A0 EE P1 |
| 6042681 | 26-Apr-2006 | 14:20:12 | 14:26:50 | 14:28:48 | 516 | 4080 | 3818870 | 12-25 | -597 | -91 | 604 | -9.10 | 112.88 | A0 a1 P1 PE |
| 6042657 | 26-Apr-2006 | 14:28:48 | 14:30:34 | 14:30:40 | 112 | 120 | 53280 | 6-12 | -599 | -91 | 606 | -9.09 | 112.69 | A1 GE P1 PE |
| 6042659 | 26-Apr-2006 | 14:36:20 | 14:36:26 | 14:39:20 | 180 | 108 | 72336 | 12-25 | -592 | -79 | 597 | -8.41 | 113.26 | A1 GS P1 PE |
| 6042682 | 26-Apr-2006 | 14:39:20 | 14:48:18 | 15:04:44 | 1524 | 560 | 1706191 | 12-25 | -597 | -94 | 604 | -9.28 | 112.66 | a0 A1 DR P1 |
| Date | Start | Peak | End | Classification | B [deg] | LCM [deg] |
|---|---|---|---|---|---|---|
| 26-Apr-2006 | 13:42 | 13:56 | 14:05 | C7.7 | -08 | -40 |
| 26-Apr-2006 | 14:32 | 14:53 | 14:58 | C9.1 | -08 | -39 |
| 26-Apr-2006 | 13:42 | 13:56 | 14:05 | C7.7 | -08 | -40 |
| 26-Apr-2006 | 14:32 | 14:53 | 14:58 | C9.1 | -08 | -39 |

