move the mouse pointer over that image.
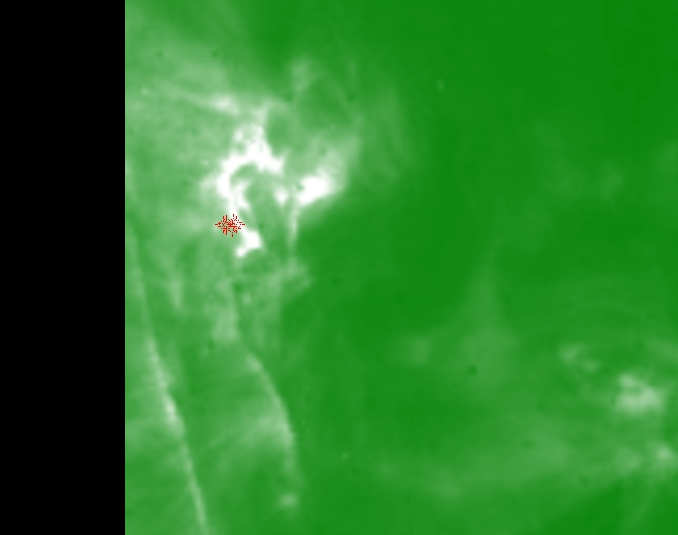
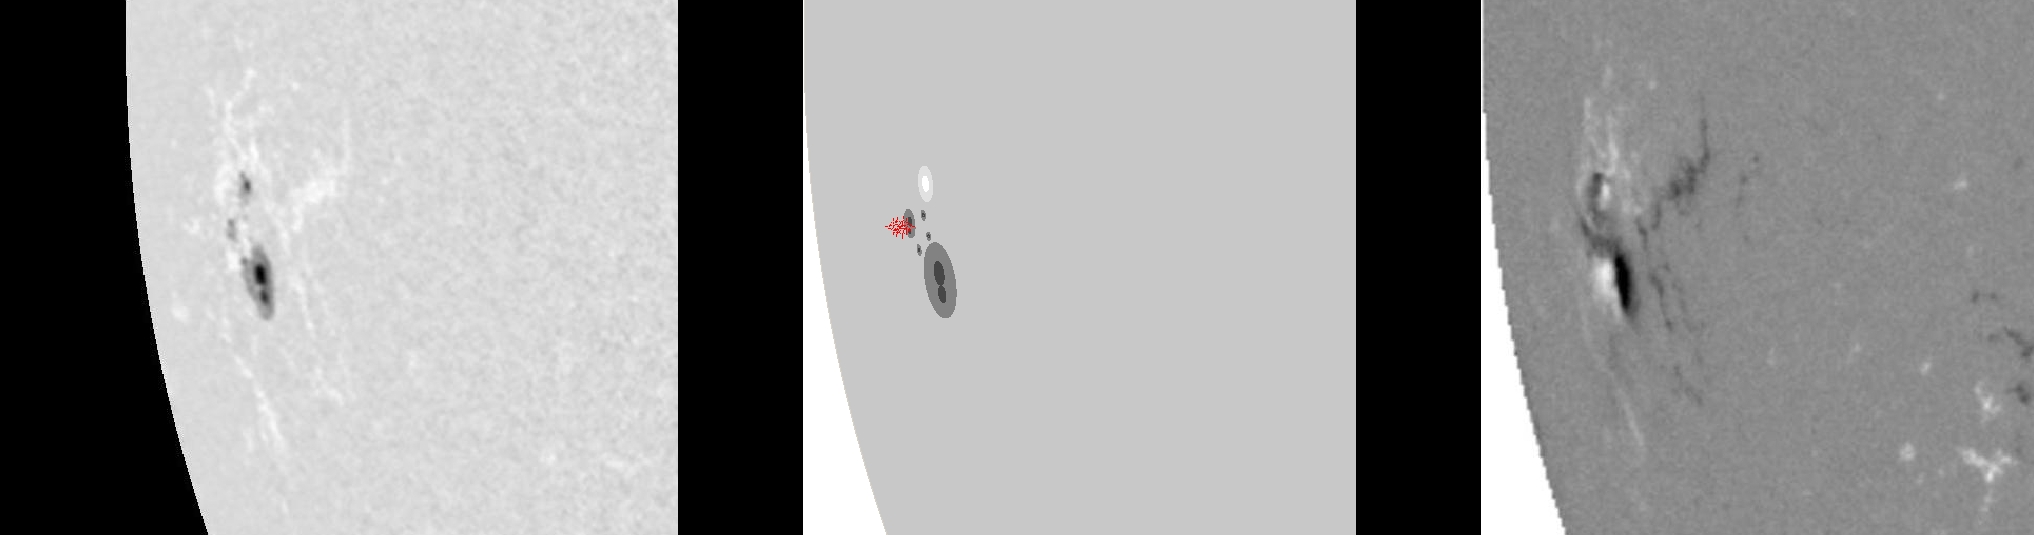
| Evolution of sunspot group NOAA 10875 and positions of flares in it animated by using the data of SOHO/MDI Debrecen Data (SDD) sunspot catalogue (lower panel, middle, ellipses with positions and areas corresponding to the relevant data of spots in SDD and with grey-scale colour coding of the magnetic polarities corresponding to that of the magnetograms), SOHO/MDI continuum images (lower panel, left) and magnetograms (lower panel, right), SOHO/EIT images (upper panel, middle), GOES and RHESSI flare data (red and blue symbols) observed within the interval around the time of SDD data. |
|
When you want to zoom in on one of the images, simply move the mouse pointer over that image. |
 |
| Year | Month | Day | Hour | Min | Sec | NOAA | Proj.U | Proj.WS | Corr.U | Corr.WS | B | L | LCM | Pos.angle | r | MU | MP |
|---|---|---|---|---|---|---|---|---|---|---|---|---|---|---|---|---|---|
| 2006 | 04 | 24 | 07 | 59 | 31 | 10875 | 48 | 330 | 62 | 431 | -10.14 | 114.81 | -68.15 | 99.01 | 0.9267 | -384.8 | -137.1 |
| Flare | Date | Start | Peak | End | Dur [s] | Peak [c/s] | Total Counts | Energy [keV] | X pos [asec] | Y pos [asec] | Radial [asec] | B [deg] | L [deg] | Flags |
|---|---|---|---|---|---|---|---|---|---|---|---|---|---|---|
| 6042409 | 24-Apr-2006 | 06:57:20 | 07:03:38 | 07:07:56 | 636 | 256 | 470928 | 6-12 | -894 | -116 | 902 | -8.62 | 111.99 | A0 |
| 6042463 | 24-Apr-2006 | 07:07:56 | 07:09:42 | 07:15:04 | 428 | 88 | 155952 | 6-12 | -894 | -119 | 902 | -8.80 | 111.86 | A0 |
| 6042432 | 24-Apr-2006 | 07:15:04 | 07:17:34 | 07:18:16 | 192 | 84 | 60312 | 6-12 | -893 | -119 | 901 | -8.81 | 111.96 | A0 DR EE P1 |
| 6042434 | 24-Apr-2006 | 08:13:40 | 08:13:54 | 08:17:12 | 212 | 128 | 83520 | 6-12 | -885 | -115 | 892 | -8.69 | 112.89 | A0 GS P1 |
| 6042435 | 24-Apr-2006 | 08:24:44 | 08:25:38 | 08:27:24 | 160 | 30 | 24480 | 6-12 | -892 | -115 | 900 | -8.59 | 111.61 | A0 |
| 6042436 | 24-Apr-2006 | 08:27:24 | 08:33:14 | 08:34:48 | 444 | 64 | 110976 | 6-12 | -889 | -114 | 897 | -8.57 | 112.08 | A0 |
| 6042464 | 24-Apr-2006 | 08:34:48 | 08:44:06 | 08:54:08 | 1160 | 184 | 641424 | 6-12 | -888 | -116 | 896 | -8.70 | 112.10 | A0 EE P1 |
| Date | Start | Peak | End | Classification | B [deg] | LCM [deg] |
|---|---|---|---|---|---|---|
| No data |

