move the mouse pointer over that image.
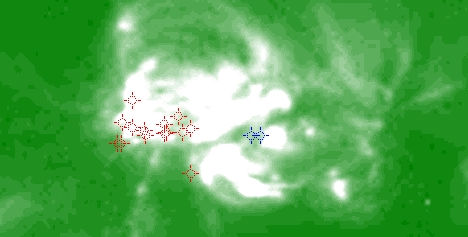
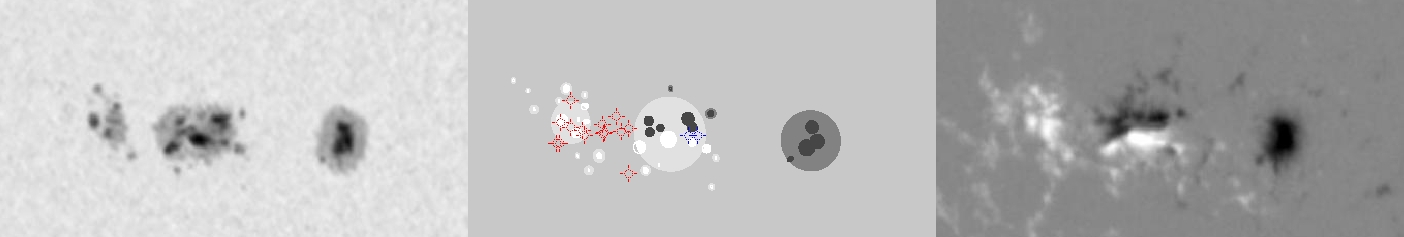
| Evolution of sunspot group NOAA 10826 and positions of flares in it animated by using the data of SOHO/MDI Debrecen Data (SDD) sunspot catalogue (lower panel, middle, ellipses with positions and areas corresponding to the relevant data of spots in SDD and with grey-scale colour coding of the magnetic polarities corresponding to that of the magnetograms), SOHO/MDI continuum images (lower panel, left) and magnetograms (lower panel, right), SOHO/EIT images (upper panel, middle), GOES and RHESSI flare data (red and blue symbols) observed within the interval around the time of SDD data. |
|
When you want to zoom in on one of the images, simply move the mouse pointer over that image. |
 |
| Year | Month | Day | Hour | Min | Sec | NOAA | Proj.U | Proj.WS | Corr.U | Corr.WS | B | L | LCM | Pos.angle | r | MU | MP |
|---|---|---|---|---|---|---|---|---|---|---|---|---|---|---|---|---|---|
| 2005 | 12 | 01 | 22 | 23 | 32 | 10826 | 226 | 1205 | 117 | 632 | -3.94 | 254.22 | -18.28 | 105.19 | 0.3249 | -155.0 | -7.1 |
| Flare | Date | Start | Peak | End | Dur [s] | Peak [c/s] | Total Counts | Energy [keV] | X pos [asec] | Y pos [asec] | Radial [asec] | B [deg] | L [deg] | Flags |
|---|---|---|---|---|---|---|---|---|---|---|---|---|---|---|
| 5120196 | 1-Dec-2005 | 21:51:52 | 21:57:58 | 22:11:20 | 1168 | 96 | 224328 | 6-12 | -370 | -59 | 375 | -2.69 | 249.04 | A0 |
| 5120197 | 1-Dec-2005 | 22:36:16 | 22:38:06 | 22:39:08 | 172 | 32 | 23688 | 6-12 | -351 | -78 | 359 | -3.82 | 249.87 | A0 |
| 5120131 | 1-Dec-2005 | 22:40:40 | 22:43:42 | 22:43:52 | 192 | 60 | 37824 | 6-12 | -357 | -76 | 366 | -3.71 | 249.44 | A0 P1 PE |
| 5120198 | 1-Dec-2005 | 23:21:20 | 23:22:14 | 23:27:52 | 392 | 72 | 62928 | 6-12 | -326 | -74 | 335 | -3.58 | 251.07 | A0 |
| 5120199 | 1-Dec-2005 | 23:35:36 | 23:36:26 | 23:38:16 | 160 | 48 | 27168 | 6-12 | -349 | -86 | 359 | -4.31 | 249.45 | A0 |
| 5120132 | 1-Dec-2005 | 23:39:28 | 23:40:34 | 23:43:00 | 212 | 304 | 152976 | 12-25 | -304 | -77 | 313 | -3.75 | 252.29 | A0 |
| 51201123 | 1-Dec-2005 | 23:43:00 | 23:43:26 | 23:46:56 | 236 | 112 | 83136 | 6-12 | -308 | -79 | 318 | -3.87 | 252.00 | A0 |
| 5120133 | 1-Dec-2005 | 23:46:56 | 23:48:26 | 23:52:04 | 308 | 80 | 63072 | 6-12 | -345 | -73 | 352 | -3.53 | 249.62 | A0 |
| 5120134 | 1-Dec-2005 | 23:55:12 | 23:57:34 | 00:01:16 | 364 | 320 | 318384 | 12-25 | -307 | -69 | 315 | -3.28 | 251.95 | A0 DR P1 |
| 5120268 | 2-Dec-2005 | 00:01:16 | 00:03:34 | 00:07:52 | 396 | 176 | 280416 | 6-12 | -313 | -79 | 323 | -3.88 | 251.51 | A0 DR P1 |
| 5120269 | 2-Dec-2005 | 00:07:52 | 00:09:46 | 00:14:24 | 392 | 108 | 149616 | 6-12 | -324 | -81 | 334 | -4.00 | 250.75 | A0 |
| 5120238 | 2-Dec-2005 | 00:14:24 | 00:16:14 | 00:17:52 | 208 | 80 | 58896 | 6-12 | -340 | -86 | 351 | -4.31 | 249.67 | A0 |
| 5120239 | 2-Dec-2005 | 00:17:52 | 00:20:02 | 00:24:08 | 376 | 192 | 197712 | 6-12 | -309 | -80 | 319 | -3.94 | 251.61 | A0 GE P1 PE |
| 5120240 | 2-Dec-2005 | 00:57:32 | 01:13:46 | 01:19:44 | 1332 | 48 | 47418 | 6-12 | -277 | -105 | 296 | -5.43 | 253.08 | a0 A1 |
| Date | Start | Peak | End | Classification | B [deg] | LCM [deg] |
|---|---|---|---|---|---|---|
| 2-Dec-2005 | 00:28 | 00:34 | 00:36 | C1.7 | -04 | -17 |
| 2-Dec-2005 | 01:08 | 01:13 | 01:15 | B9.9 | -04 | -17 |

