
move the mouse pointer over that image.
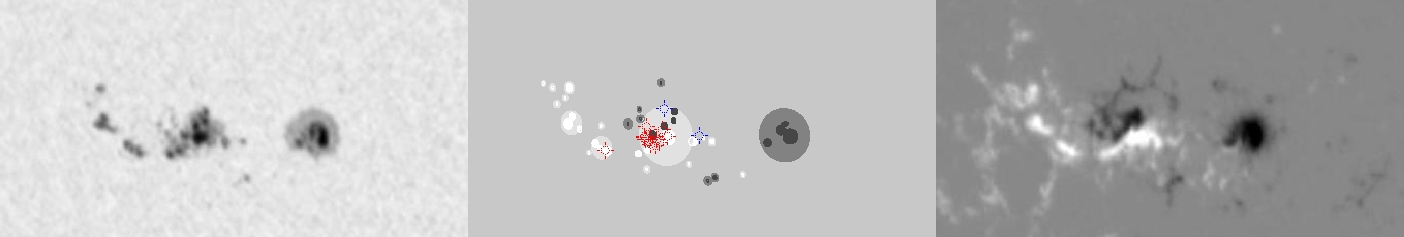
| Evolution of sunspot group NOAA 10826 and positions of flares in it animated by using the data of SOHO/MDI Debrecen Data (SDD) sunspot catalogue (lower panel, middle, ellipses with positions and areas corresponding to the relevant data of spots in SDD and with grey-scale colour coding of the magnetic polarities corresponding to that of the magnetograms), SOHO/MDI continuum images (lower panel, left) and magnetograms (lower panel, right), SOHO/EIT images (upper panel, middle), GOES and RHESSI flare data (red and blue symbols) observed within the interval around the time of SDD data. |
|
When you want to zoom in on one of the images, simply move the mouse pointer over that image. |
 |
| Year | Month | Day | Hour | Min | Sec | NOAA | Proj.U | Proj.WS | Corr.U | Corr.WS | B | L | LCM | Pos.angle | r | MU | MP |
|---|---|---|---|---|---|---|---|---|---|---|---|---|---|---|---|---|---|
| 2005 | 12 | 01 | 08 | 13 | 32 | 10826 | 141 | 805 | 79 | 447 | -3.96 | 254.27 | -26.01 | 100.84 | 0.4467 | 179.2 | 8.8 |
| Flare | Date | Start | Peak | End | Dur [s] | Peak [c/s] | Total Counts | Energy [keV] | X pos [asec] | Y pos [asec] | Radial [asec] | B [deg] | L [deg] | Flags |
|---|---|---|---|---|---|---|---|---|---|---|---|---|---|---|
| 5120154 | 1-Dec-2005 | 05:58:08 | 05:59:10 | 06:00:00 | 112 | 64 | 27456 | 6-12 | -458 | -82 | 465 | -4.03 | 251.96 | A0 DF P1 |
| 5120108 | 1-Dec-2005 | 06:04:48 | 06:07:34 | 06:09:20 | 272 | 224 | 115584 | 12-25 | -459 | -78 | 466 | -3.79 | 251.82 | A0 DF P1 |
| 5120155 | 1-Dec-2005 | 06:16:44 | 06:19:22 | 06:21:16 | 272 | 44 | 43080 | 6-12 | -463 | -83 | 470 | -4.10 | 251.43 | A0 DF P1 |
| 51201107 | 1-Dec-2005 | 06:21:16 | 06:23:02 | 06:24:48 | 212 | 36 | 28824 | 6-12 | -459 | -88 | 467 | -4.39 | 251.66 | A0 DF P1 |
| 5120110 | 1-Dec-2005 | 06:26:08 | 06:27:30 | 06:29:24 | 196 | 72 | 30576 | 6-12 | -457 | -84 | 465 | -4.15 | 251.76 | A0 DF P1 |
| 5120157 | 1-Dec-2005 | 06:29:24 | 06:32:22 | 06:34:24 | 300 | 60 | 47784 | 6-12 | -454 | -86 | 462 | -4.27 | 251.92 | A0 DF P1 |
| 5120111 | 1-Dec-2005 | 06:34:24 | 06:37:58 | 06:40:16 | 352 | 232 | 185808 | 6-12 | -458 | -83 | 465 | -4.09 | 251.60 | A0 DF P1 |
| 51201108 | 1-Dec-2005 | 06:40:16 | 06:42:02 | 06:43:36 | 200 | 208 | 93696 | 6-12 | -458 | -84 | 466 | -4.15 | 251.56 | A0 DF P1 |
| 51201109 | 1-Dec-2005 | 06:43:36 | 06:45:10 | 06:47:40 | 244 | 320 | 128832 | 12-25 | -456 | -87 | 465 | -4.33 | 251.66 | A0 DF P1 |
| 5120158 | 1-Dec-2005 | 06:47:40 | 06:48:54 | 06:50:24 | 164 | 76 | 35040 | 6-12 | -459 | -82 | 467 | -4.04 | 251.44 | A0 DF P1 |
| 5120115 | 1-Dec-2005 | 06:50:24 | 06:56:02 | 06:57:36 | 432 | 528 | 284616 | 12-25 | -456 | -76 | 462 | -3.68 | 251.59 | A0 DF DR P1 |
| 5120159 | 1-Dec-2005 | 07:31:24 | 07:32:22 | 07:33:48 | 144 | 1 | 742 | 6-12 | -447 | -84 | 454 | -4.15 | 251.85 | A0 DF GS P1 |
| 51201110 | 1-Dec-2005 | 07:33:48 | 07:34:46 | 07:36:08 | 140 | 1 | 662 | 6-12 | -447 | -83 | 455 | -4.09 | 251.83 | A0 DF P1 |
| 5120117 | 1-Dec-2005 | 07:42:20 | 07:46:14 | 08:07:12 | 1492 | 50 | 155445 | 12-25 | -769 | -105 | 776 | -5.70 | 225.98 | A0 DF P1 |
| 51201111 | 1-Dec-2005 | 08:07:12 | 08:32:54 | 08:34:36 | 1644 | 256 | 582216 | 12-25 | -456 | -91 | 465 | -4.58 | 250.67 | a0 A1 DF DR EE P1 |
| Date | Start | Peak | End | Classification | B [deg] | LCM [deg] |
|---|---|---|---|---|---|---|
| 1-Dec-2005 | 07:41 | 07:50 | 08:02 | B9.8 | -04 | -26 |
| 1-Dec-2005 | 08:15 | 08:37 | 08:50 | C6.0 | -03 | -27 |

