move the mouse pointer over that image.
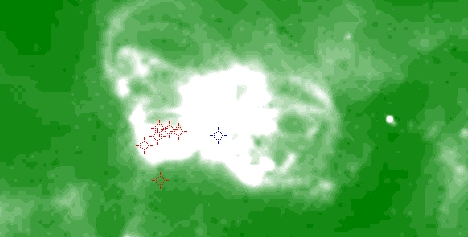
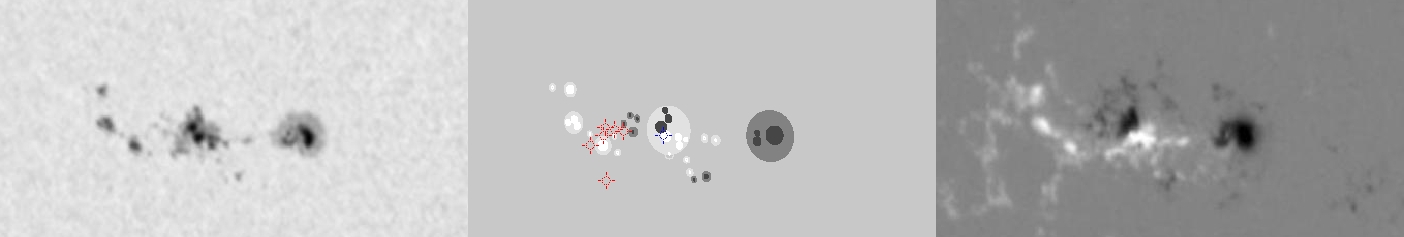
| Evolution of sunspot group NOAA 10826 and positions of flares in it animated by using the data of SOHO/MDI Debrecen Data (SDD) sunspot catalogue (lower panel, middle, ellipses with positions and areas corresponding to the relevant data of spots in SDD and with grey-scale colour coding of the magnetic polarities corresponding to that of the magnetograms), SOHO/MDI continuum images (lower panel, left) and magnetograms (lower panel, right), SOHO/EIT images (upper panel, middle), GOES and RHESSI flare data (red and blue symbols) observed within the interval around the time of SDD data. |
|
When you want to zoom in on one of the images, simply move the mouse pointer over that image. |
 |
| Year | Month | Day | Hour | Min | Sec | NOAA | Proj.U | Proj.WS | Corr.U | Corr.WS | B | L | LCM | Pos.angle | r | MU | MP |
|---|---|---|---|---|---|---|---|---|---|---|---|---|---|---|---|---|---|
| 2005 | 12 | 01 | 03 | 11 | 32 | 10826 | 120 | 644 | 69 | 366 | -3.91 | 254.40 | -28.65 | 99.81 | 0.4868 | -131.5 | 28.8 |
| Flare | Date | Start | Peak | End | Dur [s] | Peak [c/s] | Total Counts | Energy [keV] | X pos [asec] | Y pos [asec] | Radial [asec] | B [deg] | L [deg] | Flags |
|---|---|---|---|---|---|---|---|---|---|---|---|---|---|---|
| 5120150 | 1-Dec-2005 | 03:14:48 | 03:15:34 | 03:17:00 | 132 | 168 | 108864 | 6-12 | -500 | -110 | 512 | -5.72 | 250.47 | A0 |
| 5120106 | 1-Dec-2005 | 03:36:32 | 03:41:42 | 03:45:36 | 544 | 752 | 1345224 | 6-12 | -482 | -79 | 488 | -3.86 | 251.58 | A0 P1 PE |
| 51201104 | 1-Dec-2005 | 04:32:28 | 04:33:10 | 04:33:40 | 72 | 2 | 410 | 6-12 | -474 | -78 | 481 | -3.80 | 251.66 | A0 |
| 51201105 | 1-Dec-2005 | 04:37:48 | 04:38:18 | 04:39:20 | 92 | 2 | 447 | 6-12 | -479 | -77 | 485 | -3.74 | 251.27 | A0 |
| 51201106 | 1-Dec-2005 | 04:41:20 | 04:42:14 | 04:44:24 | 184 | 4 | 1093 | 6-12 | -479 | -82 | 486 | -4.04 | 251.23 | A0 |
| 5120107 | 1-Dec-2005 | 04:46:56 | 05:00:18 | 05:21:44 | 2088 | 368 | 1137283 | 12-25 | -483 | -88 | 491 | -4.40 | 250.77 | a0 A1 DF P1 |
| Date | Start | Peak | End | Classification | B [deg] | LCM [deg] |
|---|---|---|---|---|---|---|
| 1-Dec-2005 | 04:49 | 05:04 | 05:12 | C5.7 | -04 | -29 |

