move the mouse pointer over that image.
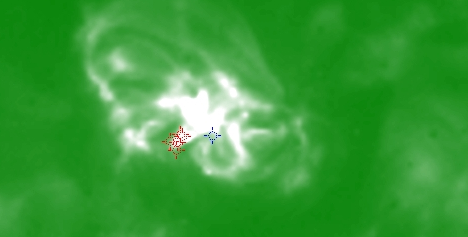
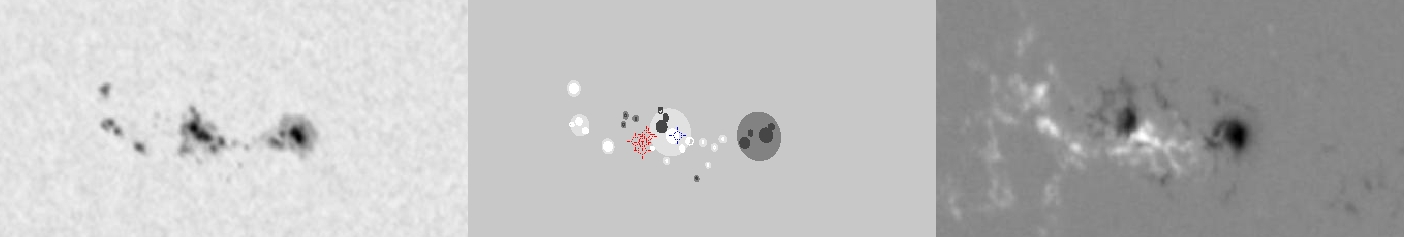
| Evolution of sunspot group NOAA 10826 and positions of flares in it animated by using the data of SOHO/MDI Debrecen Data (SDD) sunspot catalogue (lower panel, middle, ellipses with positions and areas corresponding to the relevant data of spots in SDD and with grey-scale colour coding of the magnetic polarities corresponding to that of the magnetograms), SOHO/MDI continuum images (lower panel, left) and magnetograms (lower panel, right), SOHO/EIT images (upper panel, middle), GOES and RHESSI flare data (red and blue symbols) observed within the interval around the time of SDD data. |
|
When you want to zoom in on one of the images, simply move the mouse pointer over that image. |
 |
| Year | Month | Day | Hour | Min | Sec | NOAA | Proj.U | Proj.WS | Corr.U | Corr.WS | B | L | LCM | Pos.angle | r | MU | MP |
|---|---|---|---|---|---|---|---|---|---|---|---|---|---|---|---|---|---|
| 2005 | 11 | 30 | 23 | 59 | 32 | 10826 | 119 | 541 | 68 | 314 | -3.90 | 254.39 | -30.42 | 99.26 | 0.5134 | -17.5 | -22.5 |
| Flare | Date | Start | Peak | End | Dur [s] | Peak [c/s] | Total Counts | Energy [keV] | X pos [asec] | Y pos [asec] | Radial [asec] | B [deg] | L [deg] | Flags |
|---|---|---|---|---|---|---|---|---|---|---|---|---|---|---|
| 5113053 | 30-Nov-2005 | 23:20:36 | 23:21:46 | 23:24:40 | 244 | 30 | 38616 | 6-12 | -518 | -85 | 525 | -4.22 | 251.42 | A0 |
| 5113067 | 30-Nov-2005 | 23:24:40 | 23:27:42 | 23:33:12 | 512 | 36 | 81552 | 6-12 | -512 | -86 | 519 | -4.27 | 251.79 | A0 |
| 5113068 | 30-Nov-2005 | 23:33:12 | 23:33:26 | 23:38:48 | 336 | 26 | 45120 | 6-12 | -507 | -82 | 513 | -4.03 | 252.10 | A0 |
| 5113054 | 30-Nov-2005 | 23:40:40 | 23:42:14 | 23:47:20 | 400 | 46 | 54528 | 6-12 | -506 | -81 | 513 | -3.97 | 252.10 | A0 |
| 5113069 | 30-Nov-2005 | 23:47:20 | 23:51:58 | 23:53:44 | 384 | 28 | 50016 | 6-12 | -506 | -91 | 514 | -4.57 | 251.98 | A0 |
| Date | Start | Peak | End | Classification | B [deg] | LCM [deg] |
|---|---|---|---|---|---|---|
| 1-Dec-2005 | 00:09 | 00:18 | 00:28 | C1.4 | -04 | -31 |

