move the mouse pointer over that image.
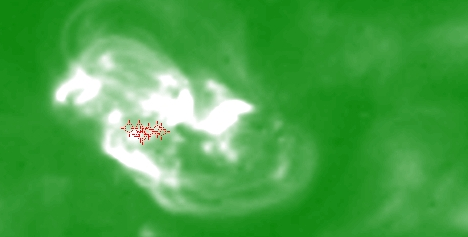
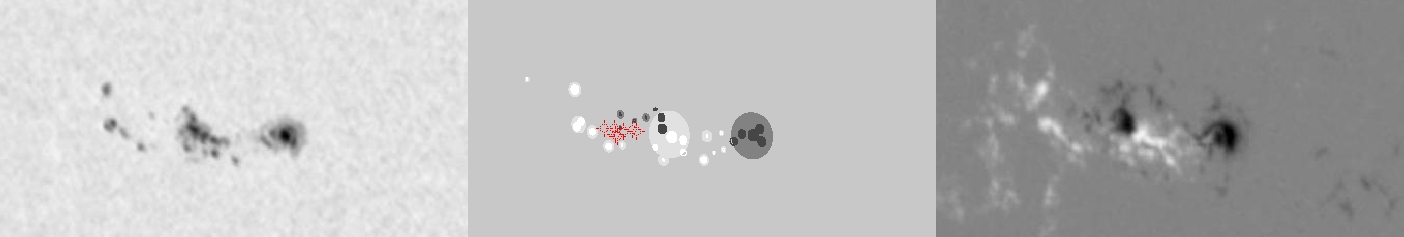
| Evolution of sunspot group NOAA 10826 and positions of flares in it animated by using the data of SOHO/MDI Debrecen Data (SDD) sunspot catalogue (lower panel, middle, ellipses with positions and areas corresponding to the relevant data of spots in SDD and with grey-scale colour coding of the magnetic polarities corresponding to that of the magnetograms), SOHO/MDI continuum images (lower panel, left) and magnetograms (lower panel, right), SOHO/EIT images (upper panel, middle), GOES and RHESSI flare data (red and blue symbols) observed within the interval around the time of SDD data. |
|
When you want to zoom in on one of the images, simply move the mouse pointer over that image. |
 |
| Year | Month | Day | Hour | Min | Sec | NOAA | Proj.U | Proj.WS | Corr.U | Corr.WS | B | L | LCM | Pos.angle | r | MU | MP |
|---|---|---|---|---|---|---|---|---|---|---|---|---|---|---|---|---|---|
| 2005 | 11 | 30 | 20 | 47 | 32 | 10826 | 114 | 522 | 66 | 305 | -3.93 | 254.26 | -32.30 | 98.82 | 0.5411 | -53.9 | -1.5 |
| Flare | Date | Start | Peak | End | Dur [s] | Peak [c/s] | Total Counts | Energy [keV] | X pos [asec] | Y pos [asec] | Radial [asec] | B [deg] | L [deg] | Flags |
|---|---|---|---|---|---|---|---|---|---|---|---|---|---|---|
| 5113050 | 30-Nov-2005 | 20:08:16 | 20:09:02 | 20:10:48 | 152 | 136 | 93072 | 6-12 | -542 | -79 | 547 | -3.86 | 251.48 | A0 |
| 5113063 | 30-Nov-2005 | 20:10:48 | 20:16:30 | 20:29:28 | 1120 | 288 | 681456 | 6-12 | -543 | -78 | 548 | -3.80 | 251.35 | A0 |
| 5113064 | 30-Nov-2005 | 20:29:28 | 20:31:42 | 20:33:04 | 216 | 34 | 37152 | 6-12 | -557 | -77 | 563 | -3.76 | 250.19 | A0 |
| 5113051 | 30-Nov-2005 | 20:33:04 | 20:34:10 | 20:37:08 | 244 | 34 | 36816 | 6-12 | -550 | -77 | 555 | -3.75 | 250.68 | A0 DR P1 |
| 5113065 | 30-Nov-2005 | 20:37:08 | 20:42:58 | 20:44:40 | 452 | 38 | 74016 | 6-12 | -546 | -82 | 552 | -4.05 | 250.87 | A0 DR P1 PE |
| 5113052 | 30-Nov-2005 | 20:44:40 | 20:47:22 | 20:52:08 | 448 | 52 | 90288 | 6-12 | -546 | -81 | 553 | -3.99 | 250.84 | A0 DR P1 PE |
| 5113066 | 30-Nov-2005 | 21:00:00 | 21:01:50 | 21:03:24 | 204 | 38 | 27792 | 6-12 | -537 | -79 | 543 | -3.86 | 251.36 | A0 |
| Date | Start | Peak | End | Classification | B [deg] | LCM [deg] |
|---|---|---|---|---|---|---|
| No data |

