move the mouse pointer over that image.
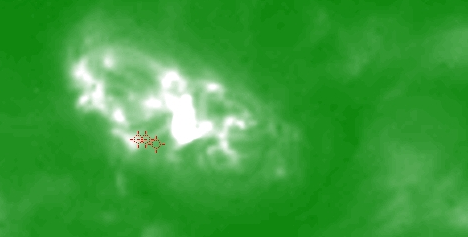
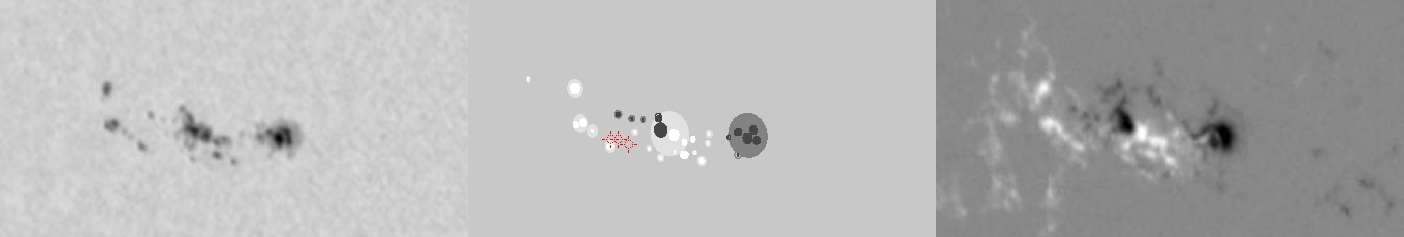
| Evolution of sunspot group NOAA 10826 and positions of flares in it animated by using the data of SOHO/MDI Debrecen Data (SDD) sunspot catalogue (lower panel, middle, ellipses with positions and areas corresponding to the relevant data of spots in SDD and with grey-scale colour coding of the magnetic polarities corresponding to that of the magnetograms), SOHO/MDI continuum images (lower panel, left) and magnetograms (lower panel, right), SOHO/EIT images (upper panel, middle), GOES and RHESSI flare data (red and blue symbols) observed within the interval around the time of SDD data. |
|
When you want to zoom in on one of the images, simply move the mouse pointer over that image. |
 |
| Year | Month | Day | Hour | Min | Sec | NOAA | Proj.U | Proj.WS | Corr.U | Corr.WS | B | L | LCM | Pos.angle | r | MU | MP |
|---|---|---|---|---|---|---|---|---|---|---|---|---|---|---|---|---|---|
| 2005 | 11 | 30 | 19 | 11 | 32 | 10826 | 108 | 485 | 63 | 287 | -3.87 | 254.04 | -33.40 | 98.45 | 0.5569 | -61.5 | 20.7 |
| Flare | Date | Start | Peak | End | Dur [s] | Peak [c/s] | Total Counts | Energy [keV] | X pos [asec] | Y pos [asec] | Radial [asec] | B [deg] | L [deg] | Flags |
|---|---|---|---|---|---|---|---|---|---|---|---|---|---|---|
| 5113048 | 30-Nov-2005 | 18:32:08 | 18:32:58 | 18:43:28 | 680 | 272 | 716088 | 6-12 | -559 | -87 | 565 | -4.35 | 251.10 | A0 |
| 5113062 | 30-Nov-2005 | 18:43:28 | 18:43:38 | 19:12:20 | 1732 | 144 | 785472 | 6-12 | -563 | -84 | 569 | -4.17 | 250.72 | A0 DR P1 PE |
| 5113049 | 30-Nov-2005 | 19:12:20 | 19:31:34 | 19:31:36 | 1156 | 48 | 278592 | 6-12 | -556 | -84 | 562 | -4.17 | 250.79 | A0 DR P1 Q2 |
| Date | Start | Peak | End | Classification | B [deg] | LCM [deg] |
|---|---|---|---|---|---|---|
| No data |

