move the mouse pointer over that image.
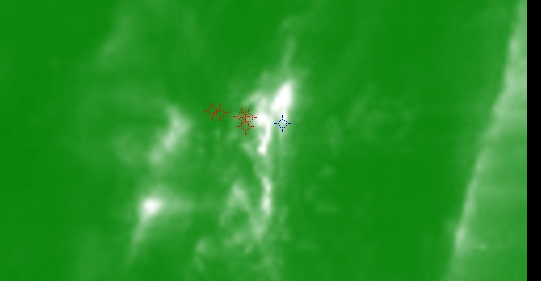
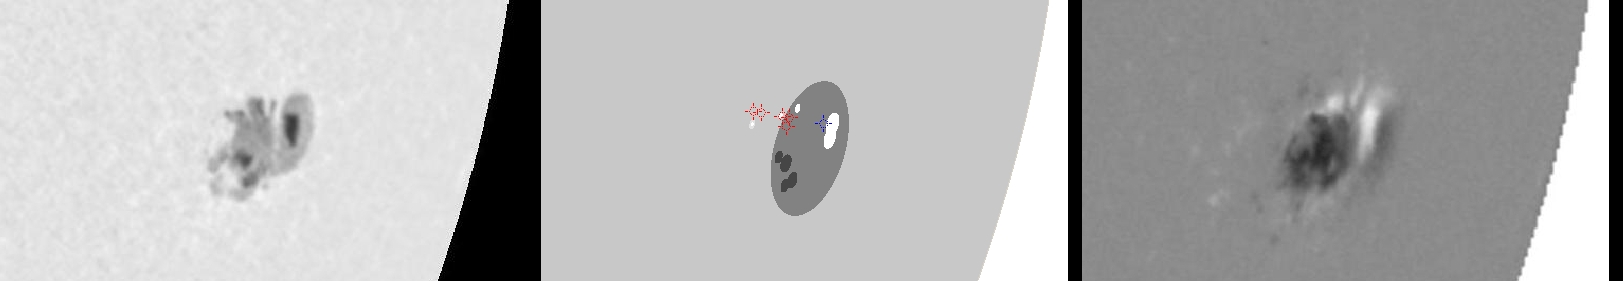
| Evolution of sunspot group NOAA 10798 and positions of flares in it animated by using the data of SOHO/MDI Debrecen Data (SDD) sunspot catalogue (lower panel, middle, ellipses with positions and areas corresponding to the relevant data of spots in SDD and with grey-scale colour coding of the magnetic polarities corresponding to that of the magnetograms), SOHO/MDI continuum images (lower panel, left) and magnetograms (lower panel, right), SOHO/EIT images (upper panel, middle), GOES and RHESSI flare data (red and blue symbols) observed within the interval around the time of SDD data. |
|
When you want to zoom in on one of the images, simply move the mouse pointer over that image. |
 |
| Year | Month | Day | Hour | Min | Sec | NOAA | Proj.U | Proj.WS | Corr.U | Corr.WS | B | L | LCM | Pos.angle | r | MU | MP |
|---|---|---|---|---|---|---|---|---|---|---|---|---|---|---|---|---|---|
| 2005 | 08 | 22 | 14 | 23 | 33 | 10798 | 102 | 1020 | 102 | 1016 | -10.70 | 226.90 | 57.75 | 253.41 | 0.8689 | -59.1 | -323.4 |
| Flare | Date | Start | Peak | End | Dur [s] | Peak [c/s] | Total Counts | Energy [keV] | X pos [asec] | Y pos [asec] | Radial [asec] | B [deg] | L [deg] | Flags |
|---|---|---|---|---|---|---|---|---|---|---|---|---|---|---|
| 5082247 | 22-Aug-2005 | 13:55:28 | 13:56:06 | 13:57:12 | 104 | 24 | 10656 | 6-12 | 782 | -227 | 814 | -9.81 | 224.30 | A0 DF DR P1 |
| 5082229 | 22-Aug-2005 | 14:10:48 | 14:14:02 | 14:17:12 | 384 | 84 | 74088 | 6-12 | 783 | -220 | 814 | -9.38 | 224.13 | A0 DF DR P1 |
| 5082206 | 22-Aug-2005 | 14:17:12 | 14:20:18 | 14:25:36 | 504 | 1072 | 886392 | 12-25 | 788 | -221 | 819 | -9.50 | 224.65 | A0 DF DR P1 |
| 5082269 | 22-Aug-2005 | 15:25:24 | 15:25:46 | 15:27:32 | 128 | 24 | 10920 | 6-12 | 782 | -216 | 811 | -9.11 | 223.31 | A0 DF P1 |
| 5082254 | 22-Aug-2005 | 15:49:20 | 15:50:02 | 15:50:52 | 92 | 42 | 13800 | 6-12 | 782 | -214 | 810 | -8.99 | 223.05 | A0 DF DR P1 |
| Date | Start | Peak | End | Classification | B [deg] | LCM [deg] |
|---|---|---|---|---|---|---|
| 22-Aug-2005 | 14:17 | 14:21 | 14:25 | B5.2 | -10 | 58 |

