move the mouse pointer over that image.
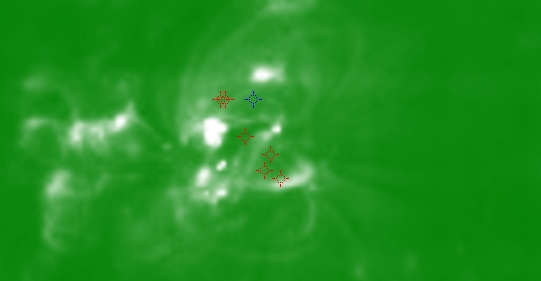
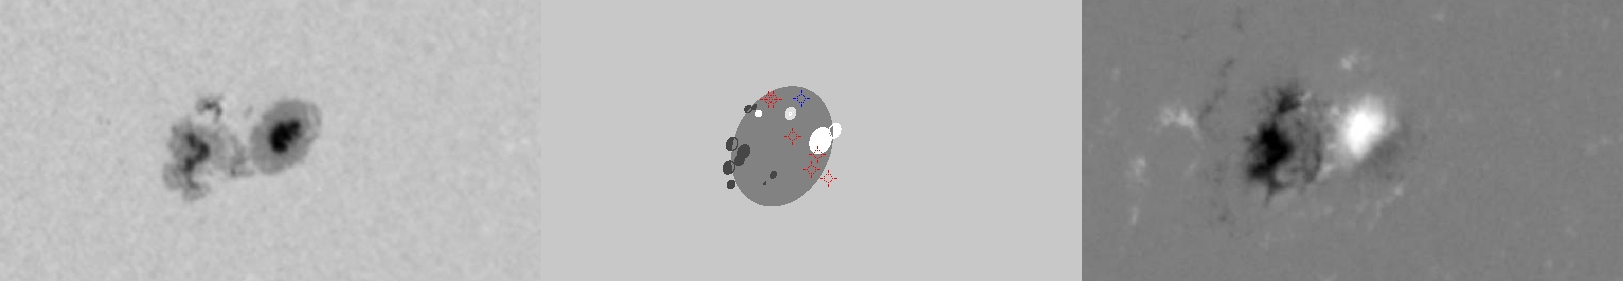
| Evolution of sunspot group NOAA 10798 and positions of flares in it animated by using the data of SOHO/MDI Debrecen Data (SDD) sunspot catalogue (lower panel, middle, ellipses with positions and areas corresponding to the relevant data of spots in SDD and with grey-scale colour coding of the magnetic polarities corresponding to that of the magnetograms), SOHO/MDI continuum images (lower panel, left) and magnetograms (lower panel, right), SOHO/EIT images (upper panel, middle), GOES and RHESSI flare data (red and blue symbols) observed within the interval around the time of SDD data. |
|
When you want to zoom in on one of the images, simply move the mouse pointer over that image. |
 |
| Year | Month | Day | Hour | Min | Sec | NOAA | Proj.U | Proj.WS | Corr.U | Corr.WS | B | L | LCM | Pos.angle | r | MU | MP |
|---|---|---|---|---|---|---|---|---|---|---|---|---|---|---|---|---|---|
| 2005 | 08 | 21 | 01 | 35 | 33 | 10798 | 159 | 1265 | 104 | 825 | -10.62 | 226.27 | 36.86 | 244.79 | 0.6536 | 102.4 | -87.9 |
| Flare | Date | Start | Peak | End | Dur [s] | Peak [c/s] | Total Counts | Energy [keV] | X pos [asec] | Y pos [asec] | Radial [asec] | B [deg] | L [deg] | Flags |
|---|---|---|---|---|---|---|---|---|---|---|---|---|---|---|
| 5082101 | 21-Aug-2005 | 01:02:36 | 01:03:14 | 01:09:44 | 428 | 880 | 636432 | 12-25 | 558 | -240 | 608 | -8.91 | 224.90 | A0 ES P1 |
| 5082167 | 21-Aug-2005 | 01:09:44 | 01:11:06 | 01:15:28 | 344 | 80 | 106128 | 6-12 | 575 | -263 | 633 | -10.44 | 226.31 | A0 |
| 5082123 | 21-Aug-2005 | 01:15:28 | 01:17:34 | 01:23:20 | 472 | 60 | 119328 | 6-12 | 588 | -284 | 653 | -11.84 | 227.47 | A0 |
| 5082168 | 21-Aug-2005 | 01:23:20 | 01:25:38 | 01:27:12 | 232 | 56 | 59280 | 6-12 | 600 | -289 | 666 | -12.24 | 228.41 | A0 |
| 5082124 | 21-Aug-2005 | 01:27:12 | 01:30:42 | 01:33:20 | 368 | 88 | 124704 | 6-12 | 595 | -274 | 655 | -11.25 | 227.80 | A0 |
| 5082169 | 21-Aug-2005 | 01:33:20 | 01:52:54 | 02:03:24 | 1804 | 976 | 2713992 | 12-25 | 573 | -239 | 621 | -8.93 | 225.57 | A0 |
| Date | Start | Peak | End | Classification | B [deg] | LCM [deg] |
|---|---|---|---|---|---|---|
| 21-Aug-2005 | 00:54 | 01:00 | 01:05 | B8.0 | -09 | 37 |

