move the mouse pointer over that image.
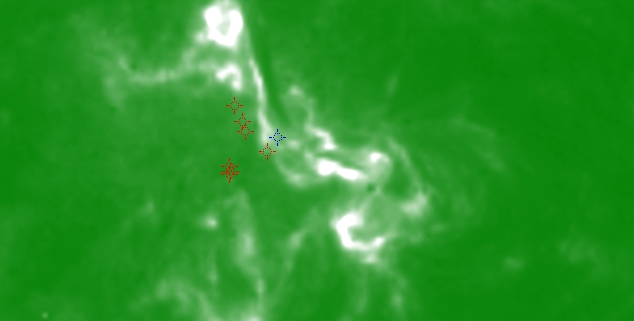
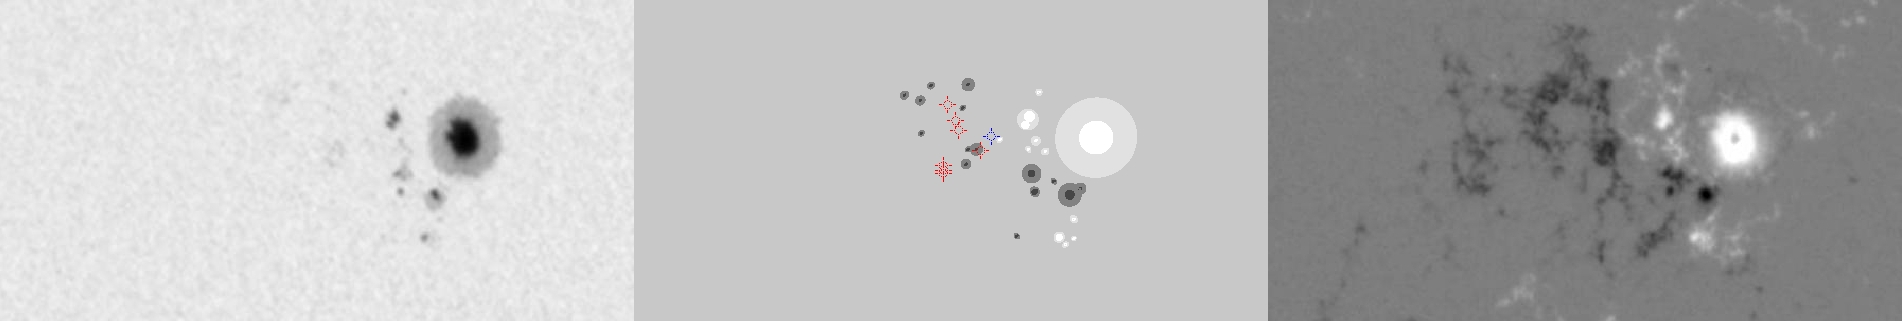
| Evolution of sunspot group NOAA 10759 and positions of flares in it animated by using the data of SOHO/MDI Debrecen Data (SDD) sunspot catalogue (lower panel, middle, ellipses with positions and areas corresponding to the relevant data of spots in SDD and with grey-scale colour coding of the magnetic polarities corresponding to that of the magnetograms), SOHO/MDI continuum images (lower panel, left) and magnetograms (lower panel, right), SOHO/EIT images (upper panel, middle), GOES and RHESSI flare data (red and blue symbols) observed within the interval around the time of SDD data. |
|
When you want to zoom in on one of the images, simply move the mouse pointer over that image. |
 |
| Year | Month | Day | Hour | Min | Sec | NOAA | Proj.U | Proj.WS | Corr.U | Corr.WS | B | L | LCM | Pos.angle | r | MU | MP |
|---|---|---|---|---|---|---|---|---|---|---|---|---|---|---|---|---|---|
| 2005 | 05 | 13 | 17 | 35 | 32 | 10759 | 150 | 960 | 77 | 494 | 11.64 | 56.64 | -7.41 | 26.81 | 0.2809 | 1365.9 | 390.1 |
| Flare | Date | Start | Peak | End | Dur [s] | Peak [c/s] | Total Counts | Energy [keV] | X pos [asec] | Y pos [asec] | Radial [asec] | B [deg] | L [deg] | Flags |
|---|---|---|---|---|---|---|---|---|---|---|---|---|---|---|
| 5051310 | 13-May-2005 | 16:36:28 | 16:54:58 | 17:14:20 | 2272 | 6507 | 46101460 | 50-100 | -174 | 238 | 295 | 11.44 | 52.65 | a0 a1 A3 DF DR GE P1 PE |
| 5051311 | 13-May-2005 | 18:12:32 | 18:13:26 | 18:15:48 | 196 | 44 | 44790 | 6-12 | -172 | 267 | 318 | 13.23 | 51.98 | a0 A1 DF P1 |
| 5051374 | 13-May-2005 | 18:15:48 | 18:16:42 | 18:21:44 | 356 | 42 | 76092 | 6-12 | -166 | 257 | 306 | 12.61 | 52.35 | a0 A1 DF P1 |
| 5051375 | 13-May-2005 | 18:21:44 | 18:37:10 | 18:50:56 | 1752 | 96 | 717529 | 6-12 | -158 | 251 | 296 | 12.24 | 52.67 | a0 A1 DF DR P1 |
| 5051312 | 13-May-2005 | 19:48:08 | 19:48:42 | 20:10:08 | 1320 | 147 | 956042 | 12-25 | -146 | 226 | 269 | 10.70 | 52.81 | A0 a1 DF DR ES P1 |
| 5051376 | 13-May-2005 | 20:10:08 | 20:13:34 | 20:30:00 | 1192 | 123 | 779735 | 12-25 | -139 | 229 | 268 | 10.88 | 53.00 | A0 DF DR P1 |
| 5051355 | 13-May-2005 | 20:30:00 | 20:33:18 | 20:33:36 | 216 | 115 | 131743 | 12-25 | -133 | 224 | 261 | 10.58 | 53.19 | A0 DF P1 PE |
| Date | Start | Peak | End | Classification | B [deg] | LCM [deg] |
|---|---|---|---|---|---|---|
| 13-May-2005 | 16:13 | 16:57 | 17:28 | M8.0 | 12 | -11 |

