move the mouse pointer over that image.
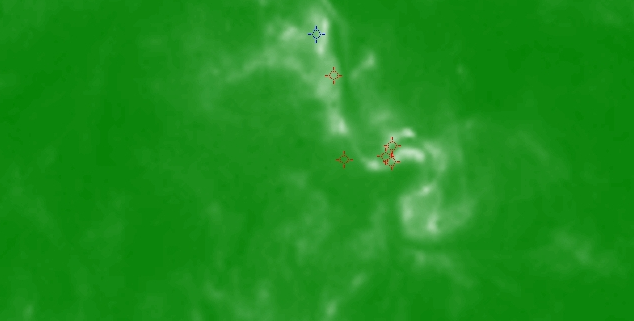
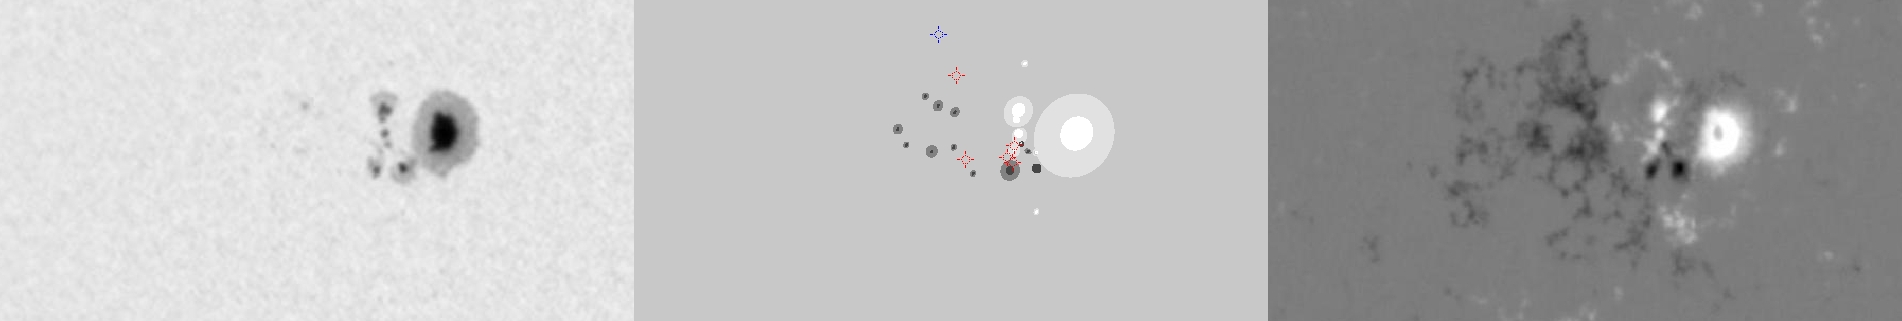
| Evolution of sunspot group NOAA 10759 and positions of flares in it animated by using the data of SOHO/MDI Debrecen Data (SDD) sunspot catalogue (lower panel, middle, ellipses with positions and areas corresponding to the relevant data of spots in SDD and with grey-scale colour coding of the magnetic polarities corresponding to that of the magnetograms), SOHO/MDI continuum images (lower panel, left) and magnetograms (lower panel, right), SOHO/EIT images (upper panel, middle), GOES and RHESSI flare data (red and blue symbols) observed within the interval around the time of SDD data. |
|
When you want to zoom in on one of the images, simply move the mouse pointer over that image. |
 |
| Year | Month | Day | Hour | Min | Sec | NOAA | Proj.U | Proj.WS | Corr.U | Corr.WS | B | L | LCM | Pos.angle | r | MU | MP |
|---|---|---|---|---|---|---|---|---|---|---|---|---|---|---|---|---|---|
| 2005 | 05 | 12 | 12 | 22 | 32 | 10759 | 154 | 931 | 85 | 521 | 11.89 | 56.72 | -23.44 | 57.09 | 0.4653 | 1277.3 | 384.6 |
| Flare | Date | Start | Peak | End | Dur [s] | Peak [c/s] | Total Counts | Energy [keV] | X pos [asec] | Y pos [asec] | Radial [asec] | B [deg] | L [deg] | Flags |
|---|---|---|---|---|---|---|---|---|---|---|---|---|---|---|
| 5051216 | 12-May-2005 | 10:14:28 | 10:22:46 | 10:33:40 | 1152 | 216 | 631152 | 6-12 | -452 | 282 | 533 | 14.36 | 51.11 | A0 DF DR P1 |
| 5051282 | 12-May-2005 | 10:33:40 | 10:34:50 | 10:37:52 | 252 | 28 | 27456 | 6-12 | -413 | 238 | 477 | 11.57 | 54.02 | A0 DF P1 |
| 5051258 | 12-May-2005 | 10:37:52 | 10:39:26 | 10:42:24 | 272 | 20 | 19392 | 6-12 | -416 | 231 | 476 | 11.14 | 53.82 | A0 DF P1 |
| 5051260 | 12-May-2005 | 10:47:20 | 10:52:22 | 10:56:44 | 564 | 92 | 111480 | 6-12 | -409 | 228 | 468 | 10.95 | 54.19 | A0 DF P1 |
| 5051263 | 12-May-2005 | 12:24:20 | 12:26:54 | 12:45:20 | 1260 | 46 | 135000 | 6-12 | -413 | 230 | 473 | 11.08 | 53.04 | A0 DF DR P1 |
| 5051219 | 12-May-2005 | 13:34:08 | 13:55:02 | 14:13:00 | 2332 | 1456 | 6636792 | 6-12 | 839 | -156 | 853 | -10.75 | 140.85 | A0 DF DR P1 PE Q4 |
| Date | Start | Peak | End | Classification | B [deg] | LCM [deg] |
|---|---|---|---|---|---|---|
| 12-May-2005 | 10:21 | 10:28 | 10:33 | B9.5 | 16 | -30 |
| 12-May-2005 | 13:40 | 13:55 | 14:21 | C3.0 | -11 | 62 |

