move the mouse pointer over that image.
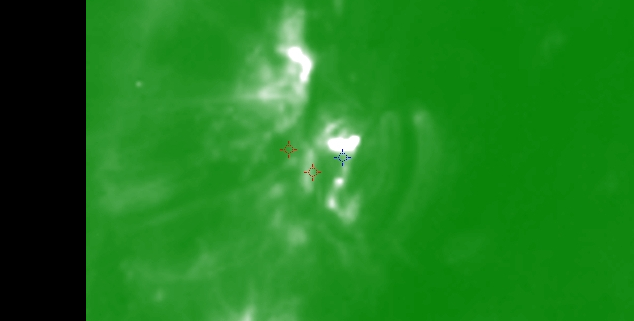
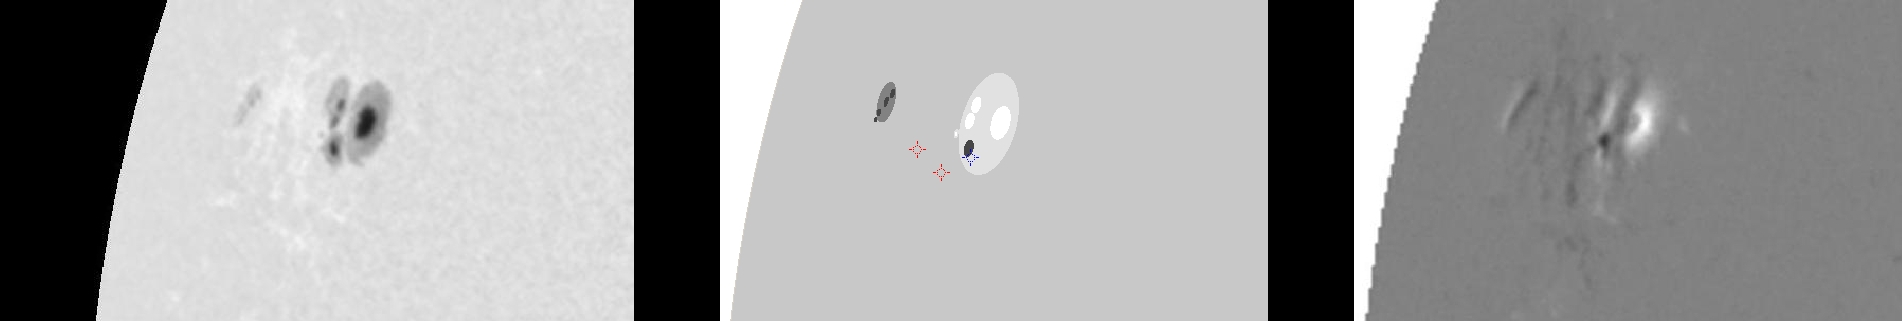
| Evolution of sunspot group NOAA 10759 and positions of flares in it animated by using the data of SOHO/MDI Debrecen Data (SDD) sunspot catalogue (lower panel, middle, ellipses with positions and areas corresponding to the relevant data of spots in SDD and with grey-scale colour coding of the magnetic polarities corresponding to that of the magnetograms), SOHO/MDI continuum images (lower panel, left) and magnetograms (lower panel, right), SOHO/EIT images (upper panel, middle), GOES and RHESSI flare data (red and blue symbols) observed within the interval around the time of SDD data. |
|
When you want to zoom in on one of the images, simply move the mouse pointer over that image. |
 |
| Year | Month | Day | Hour | Min | Sec | NOAA | Proj.U | Proj.WS | Corr.U | Corr.WS | B | L | LCM | Pos.angle | r | MU | MP |
|---|---|---|---|---|---|---|---|---|---|---|---|---|---|---|---|---|---|
| 2005 | 05 | 09 | 22 | 23 | 32 | 10759 | 111 | 667 | 111 | 667 | 12.35 | 55.70 | -58.62 | 73.79 | 0.8691 | 515.6 | 216.8 |
| Flare | Date | Start | Peak | End | Dur [s] | Peak [c/s] | Total Counts | Energy [keV] | X pos [asec] | Y pos [asec] | Radial [asec] | B [deg] | L [deg] | Flags |
|---|---|---|---|---|---|---|---|---|---|---|---|---|---|---|
| 5050981 | 9-May-2005 | 21:36:44 | 21:38:02 | 21:56:16 | 1172 | 168 | 570624 | 6-12 | -834 | 217 | 862 | 11.52 | 51.22 | A0 DF DR P1 |
| 5050920 | 9-May-2005 | 23:04:00 | 23:04:30 | 23:14:44 | 644 | 117 | 125817 | 12-25 | -806 | 204 | 831 | 10.53 | 54.25 | A0 a1 DF ES P1 |
| Date | Start | Peak | End | Classification | B [deg] | LCM [deg] |
|---|---|---|---|---|---|---|
| 9-May-2005 | 22:45 | 23:05 | 23:11 | C2.7 | 11 | -58 |

