move the mouse pointer over that image.
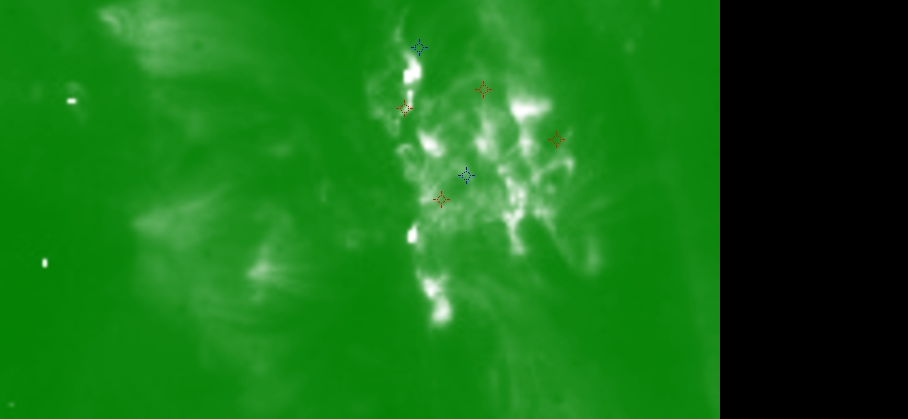
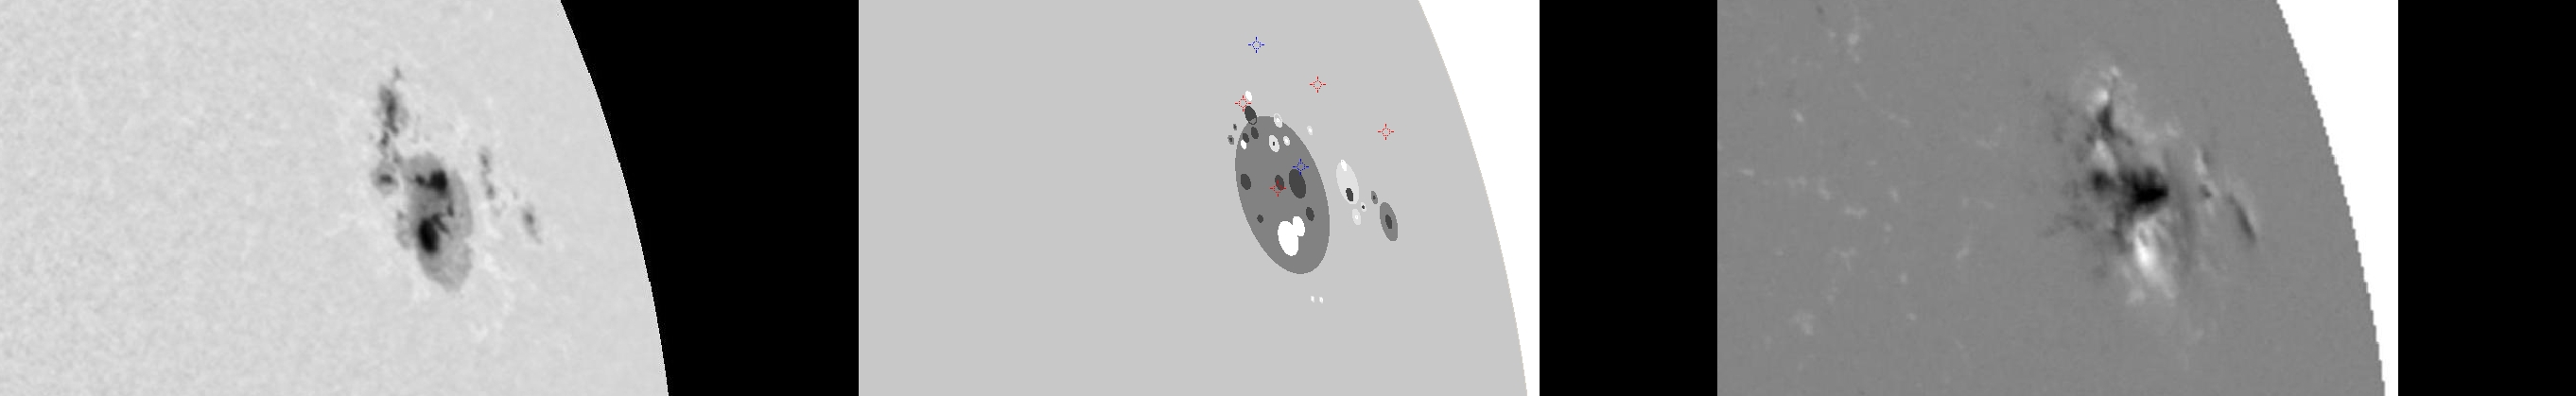
| Evolution of sunspot group NOAA 10720 and positions of flares in it animated by using the data of SOHO/MDI Debrecen Data (SDD) sunspot catalogue (lower panel, middle, ellipses with positions and areas corresponding to the relevant data of spots in SDD and with grey-scale colour coding of the magnetic polarities corresponding to that of the magnetograms), SOHO/MDI continuum images (lower panel, left) and magnetograms (lower panel, right), SOHO/EIT images (upper panel, middle), GOES and RHESSI flare data (red and blue symbols) observed within the interval around the time of SDD data. |
|
When you want to zoom in on one of the images, simply move the mouse pointer over that image. |
 |
| Year | Month | Day | Hour | Min | Sec | NOAA | Proj.U | Proj.WS | Corr.U | Corr.WS | B | L | LCM | Pos.angle | r | MU | MP |
|---|---|---|---|---|---|---|---|---|---|---|---|---|---|---|---|---|---|
| 2005 | 01 | 20 | 03 | 36 | 32 | 10720 | 257 | 1836 | 259 | 1850 | 12.83 | 179.64 | 58.21 | 287.83 | 0.8718 | -205.8 | -185.4 |
| Flare | Date | Start | Peak | End | Dur [s] | Peak [c/s] | Total Counts | Energy [keV] | X pos [asec] | Y pos [asec] | Radial [asec] | B [deg] | L [deg] | Flags |
|---|---|---|---|---|---|---|---|---|---|---|---|---|---|---|
| 5012077 | 20-Jan-2005 | 02:04:20 | 02:17:22 | 02:18:20 | 840 | 128 | 406320 | 6-12 | 852 | 297 | 902 | 16.16 | 188.86 | A0 DF DR GE P1 |
| 5012078 | 20-Jan-2005 | 05:18:12 | 05:18:34 | 05:19:48 | 96 | 18 | 8784 | 6-12 | 785 | 312 | 845 | 16.38 | 178.11 | A0 DF P1 |
| 5012004 | 20-Jan-2005 | 05:20:40 | 05:22:38 | 05:26:52 | 372 | 44 | 56160 | 6-12 | 830 | 324 | 891 | 17.67 | 184.78 | A0 DF P1 |
| 5012005 | 20-Jan-2005 | 06:20:36 | 06:51:10 | 07:27:16 | 4000 | 58605 | 318884832 | 300-800 | 821 | 253 | 859 | 12.91 | 180.13 | a0 a1 A3 DF DR P1 PE |
| Date | Start | Peak | End | Classification | B [deg] | LCM [deg] |
|---|---|---|---|---|---|---|
| 20-Jan-2005 | 03:21 | 03:30 | 03:36 | C4.8 | 19 | 58 |
| 20-Jan-2005 | 06:36 | 07:01 | 07:26 | X7.1 | 14 | 61 |

