move the mouse pointer over that image.
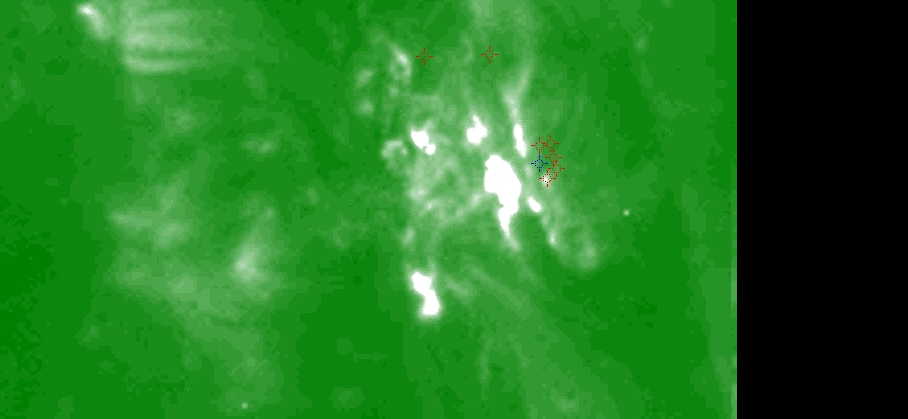
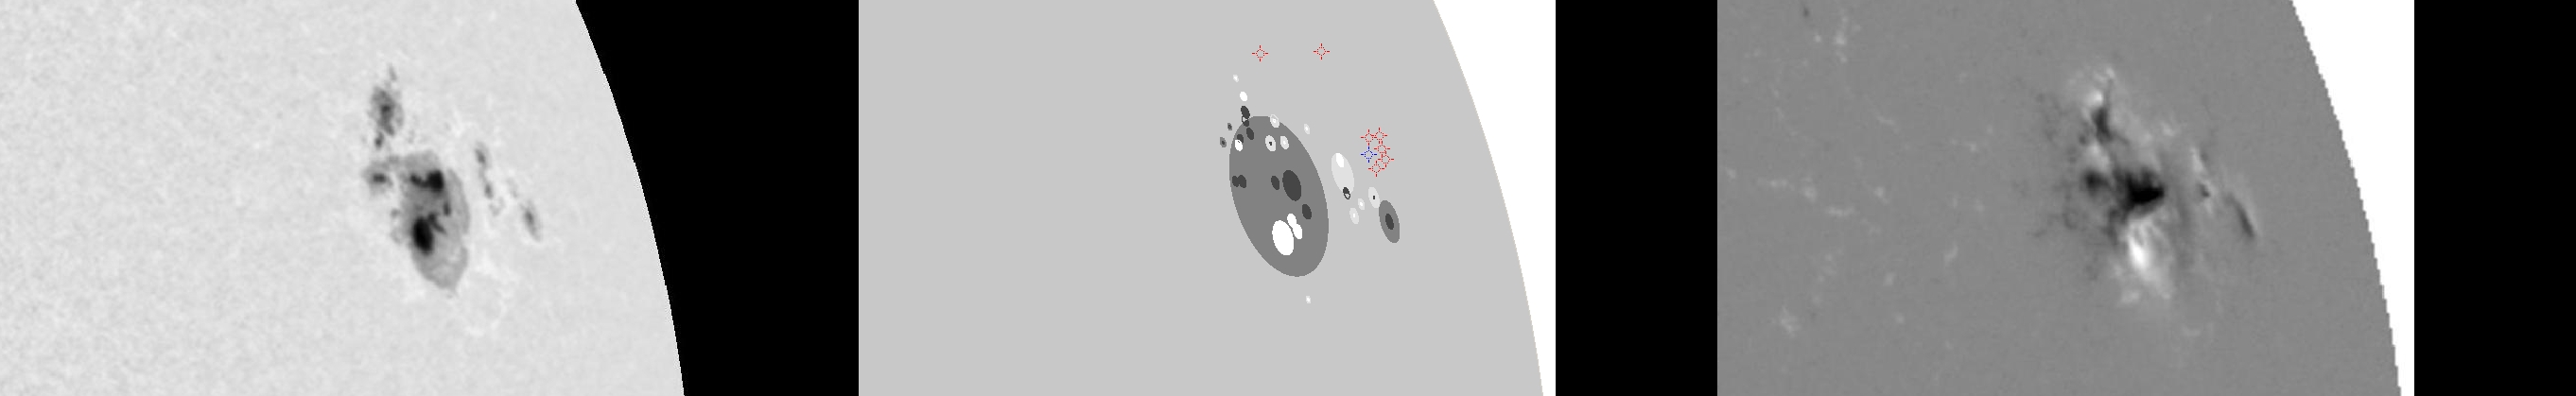
| Evolution of sunspot group NOAA 10720 and positions of flares in it animated by using the data of SOHO/MDI Debrecen Data (SDD) sunspot catalogue (lower panel, middle, ellipses with positions and areas corresponding to the relevant data of spots in SDD and with grey-scale colour coding of the magnetic polarities corresponding to that of the magnetograms), SOHO/MDI continuum images (lower panel, left) and magnetograms (lower panel, right), SOHO/EIT images (upper panel, middle), GOES and RHESSI flare data (red and blue symbols) observed within the interval around the time of SDD data. |
|
When you want to zoom in on one of the images, simply move the mouse pointer over that image. |
 |
| Year | Month | Day | Hour | Min | Sec | NOAA | Proj.U | Proj.WS | Corr.U | Corr.WS | B | L | LCM | Pos.angle | r | MU | MP |
|---|---|---|---|---|---|---|---|---|---|---|---|---|---|---|---|---|---|
| 2005 | 01 | 20 | 00 | 49 | 32 | 10720 | 277 | 2012 | 269 | 1949 | 12.82 | 179.77 | 56.81 | 288.20 | 0.8601 | -220.2 | -177.0 |
| Flare | Date | Start | Peak | End | Dur [s] | Peak [c/s] | Total Counts | Energy [keV] | X pos [asec] | Y pos [asec] | Radial [asec] | B [deg] | L [deg] | Flags |
|---|---|---|---|---|---|---|---|---|---|---|---|---|---|---|
| 5011976 | 19-Jan-2005 | 23:54:16 | 23:54:42 | 00:00:12 | 356 | 100 | 87072 | 6-12 | 761 | 350 | 838 | 18.69 | 179.42 | A0 DF P1 |
| 5012048 | 20-Jan-2005 | 00:20:36 | 00:22:10 | 00:27:44 | 428 | 64 | 99744 | 6-12 | 805 | 351 | 878 | 19.20 | 184.99 | A0 DF DR P1 PE |
| 5012001 | 20-Jan-2005 | 00:38:28 | 00:46:14 | 00:54:20 | 952 | 1392 | 3820560 | 12-25 | 844 | 273 | 887 | 14.47 | 187.38 | A0 DF GE P1 PE |
| 5012049 | 20-Jan-2005 | 01:40:16 | 01:42:14 | 01:45:12 | 296 | 36 | 42576 | 6-12 | 846 | 292 | 895 | 15.75 | 187.95 | A0 DF P1 |
| 5012075 | 20-Jan-2005 | 01:45:12 | 01:48:18 | 01:53:24 | 492 | 34 | 73704 | 6-12 | 853 | 293 | 902 | 15.91 | 189.11 | A0 DF P1 |
| 5012002 | 20-Jan-2005 | 01:56:44 | 01:57:46 | 01:59:40 | 176 | 128 | 60840 | 12-25 | 858 | 277 | 901 | 14.92 | 189.17 | A0 DF P1 |
| 5012076 | 20-Jan-2005 | 01:59:40 | 02:00:34 | 02:04:20 | 280 | 80 | 79056 | 6-12 | 856 | 284 | 902 | 15.36 | 189.11 | A0 DF P1 |
| Date | Start | Peak | End | Classification | B [deg] | LCM [deg] |
|---|---|---|---|---|---|---|
| 20-Jan-2005 | 00:37 | 00:47 | 00:56 | C1.6 | 15 | 64 |

