move the mouse pointer over that image.
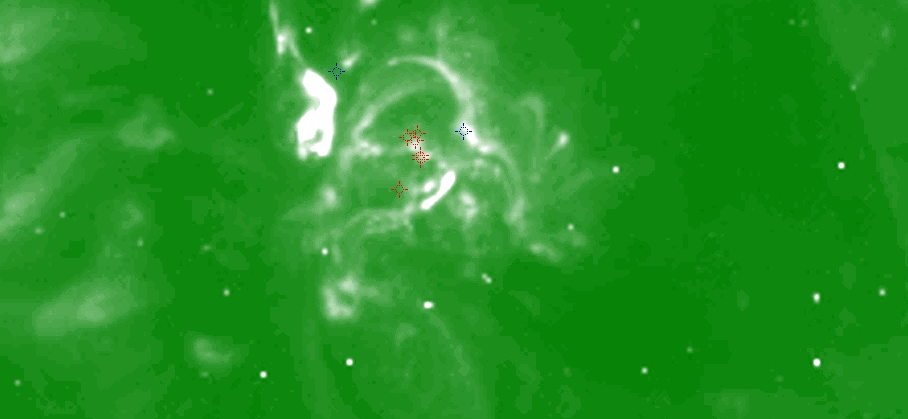
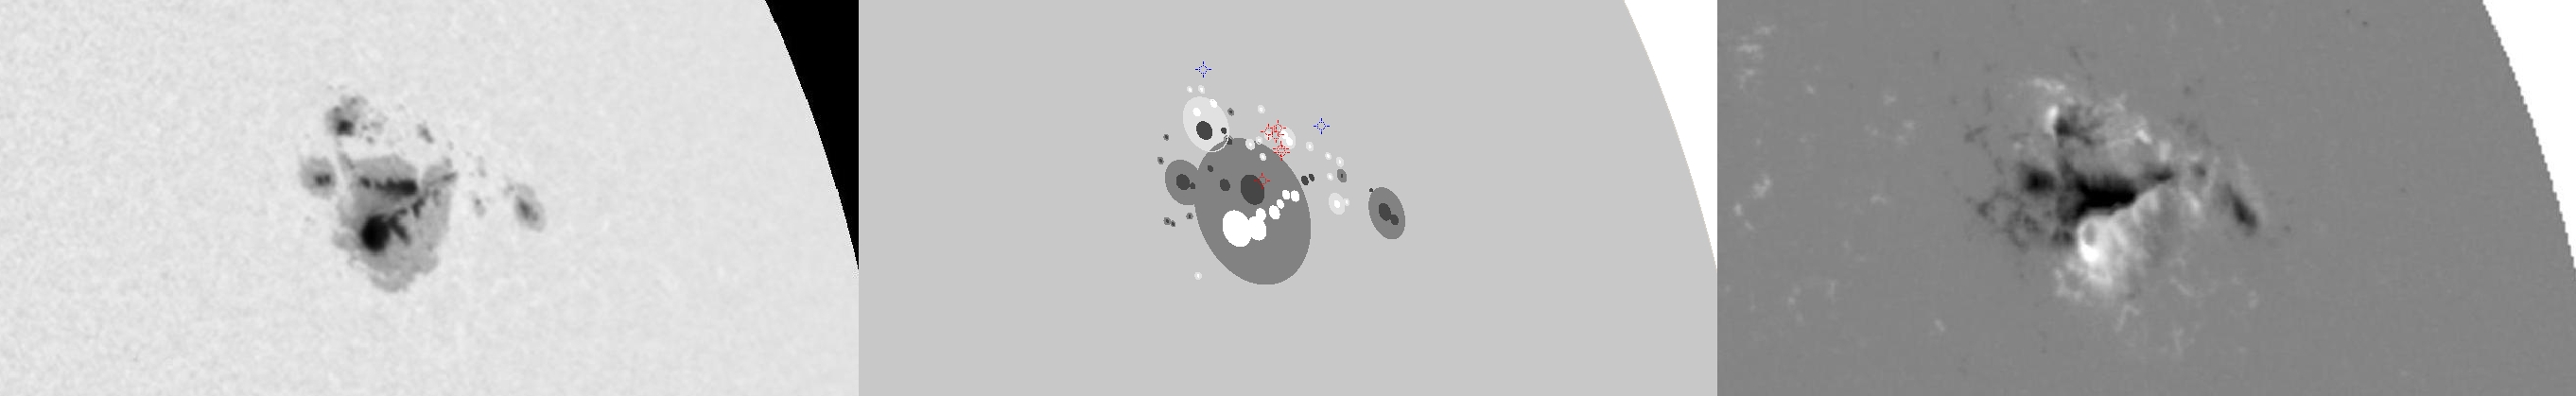
| Evolution of sunspot group NOAA 10720 and positions of flares in it animated by using the data of SOHO/MDI Debrecen Data (SDD) sunspot catalogue (lower panel, middle, ellipses with positions and areas corresponding to the relevant data of spots in SDD and with grey-scale colour coding of the magnetic polarities corresponding to that of the magnetograms), SOHO/MDI continuum images (lower panel, left) and magnetograms (lower panel, right), SOHO/EIT images (upper panel, middle), GOES and RHESSI flare data (red and blue symbols) observed within the interval around the time of SDD data. |
|
When you want to zoom in on one of the images, simply move the mouse pointer over that image. |
 |
| Year | Month | Day | Hour | Min | Sec | NOAA | Proj.U | Proj.WS | Corr.U | Corr.WS | B | L | LCM | Pos.angle | r | MU | MP |
|---|---|---|---|---|---|---|---|---|---|---|---|---|---|---|---|---|---|
| 2005 | 01 | 18 | 21 | 37 | 32 | 10720 | 438 | 2829 | 308 | 1994 | 12.78 | 179.99 | 42.10 | 293.42 | 0.7141 | -118.8 | -169.4 |
| Flare | Date | Start | Peak | End | Dur [s] | Peak [c/s] | Total Counts | Energy [keV] | X pos [asec] | Y pos [asec] | Radial [asec] | B [deg] | L [deg] | Flags |
|---|---|---|---|---|---|---|---|---|---|---|---|---|---|---|
| 5011808 | 18-Jan-2005 | 21:13:32 | 21:18:06 | 21:25:24 | 712 | 4592 | 11510382 | 12-25 | 637 | 281 | 697 | 13.46 | 180.22 | A0 DF DR GD GS P1 PE |
| 5011804 | 18-Jan-2005 | 21:25:24 | 21:26:22 | 21:34:56 | 572 | 2032 | 3534336 | 12-25 | 651 | 302 | 718 | 14.86 | 181.68 | A0 P1 PE |
| 5011806 | 18-Jan-2005 | 22:16:36 | 22:17:54 | 22:41:56 | 1520 | 92 | 385069 | 12-25 | 662 | 299 | 727 | 14.73 | 182.13 | a0 A1 P1 PE |
| 5011878 | 18-Jan-2005 | 22:41:56 | 22:45:18 | 22:58:00 | 964 | 13 | 51776 | 12-25 | 664 | 310 | 733 | 15.45 | 182.26 | A0 DR P1 PE |
| 5011812 | 18-Jan-2005 | 22:59:12 | 23:04:18 | 23:05:40 | 388 | 14 | 23304 | 12-25 | 669 | 314 | 739 | 15.73 | 182.61 | A0 DR P1 PE |
| 5011879 | 18-Jan-2005 | 23:05:40 | 23:06:54 | 23:12:40 | 420 | 14 | 23826 | 12-25 | 664 | 312 | 734 | 15.57 | 182.09 | A0 P1 PE |
| Date | Start | Peak | End | Classification | B [deg] | LCM [deg] |
|---|---|---|---|---|---|---|
| 18-Jan-2005 | 18:43 | 18:48 | 18:52 | C2.1 | 16 | 45 |
| 18-Jan-2005 | 18:56 | 19:01 | 19:09 | C4.2 | 18 | 39 |

