move the mouse pointer over that image.
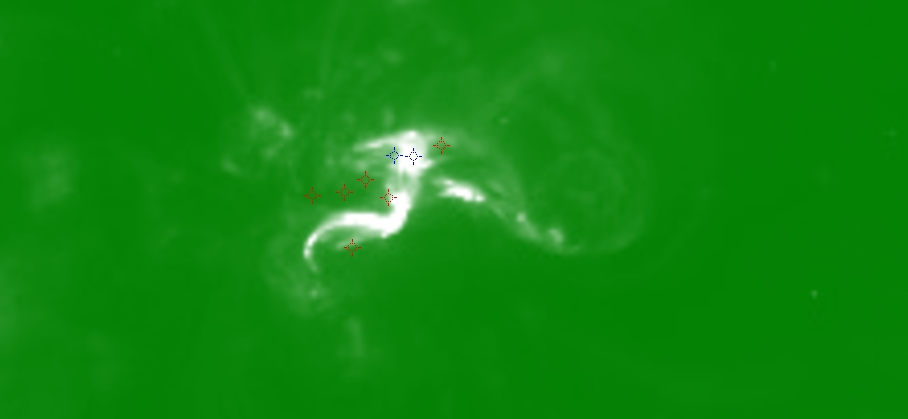
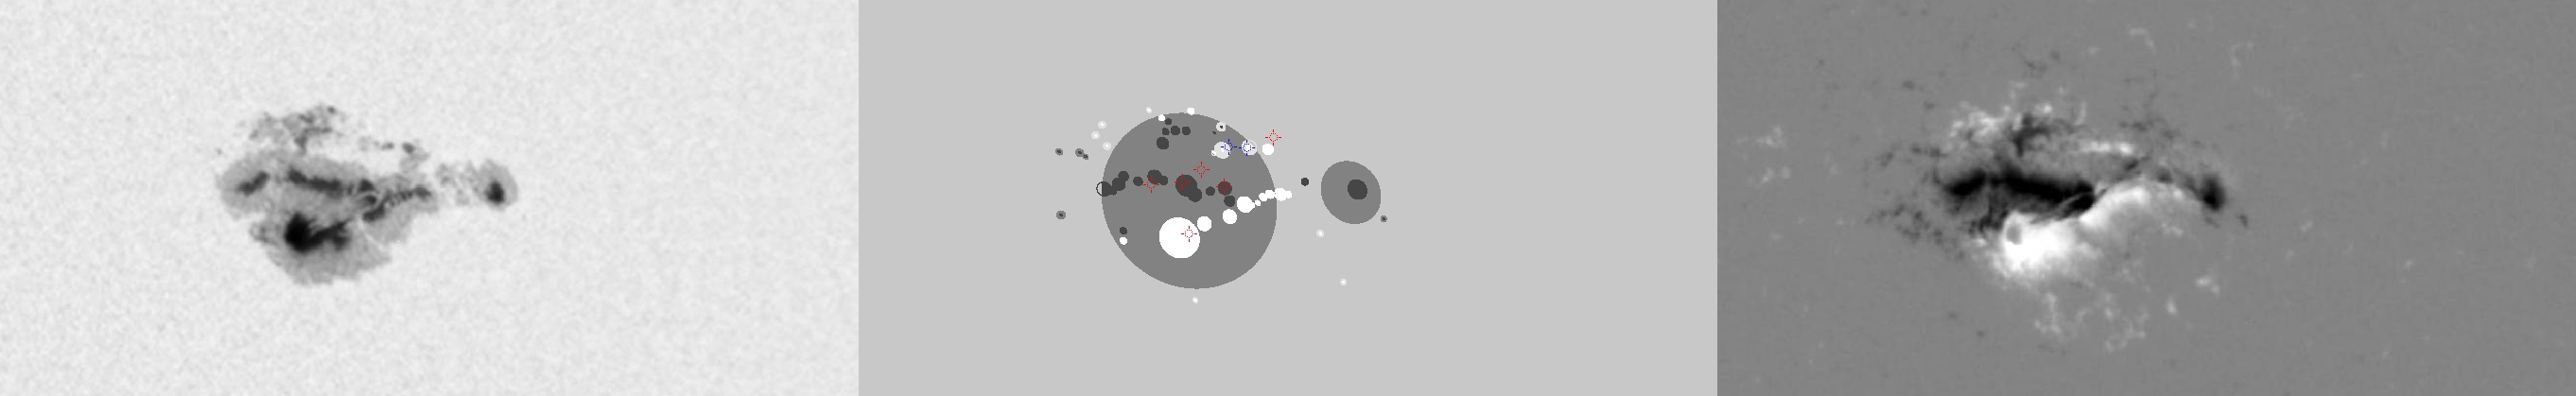
| Evolution of sunspot group NOAA 10720 and positions of flares in it animated by using the data of SOHO/MDI Debrecen Data (SDD) sunspot catalogue (lower panel, middle, ellipses with positions and areas corresponding to the relevant data of spots in SDD and with grey-scale colour coding of the magnetic polarities corresponding to that of the magnetograms), SOHO/MDI continuum images (lower panel, left) and magnetograms (lower panel, right), SOHO/EIT images (upper panel, middle), GOES and RHESSI flare data (red and blue symbols) observed within the interval around the time of SDD data. |
|
When you want to zoom in on one of the images, simply move the mouse pointer over that image. |
 |
| Year | Month | Day | Hour | Min | Sec | NOAA | Proj.U | Proj.WS | Corr.U | Corr.WS | B | L | LCM | Pos.angle | r | MU | MP |
|---|---|---|---|---|---|---|---|---|---|---|---|---|---|---|---|---|---|
| 2005 | 01 | 17 | 03 | 11 | 32 | 10720 | 645 | 4174 | 357 | 2297 | 12.75 | 180.11 | 18.93 | 313.35 | 0.4360 | -106.8 | -73.2 |
| Flare | Date | Start | Peak | End | Dur [s] | Peak [c/s] | Total Counts | Energy [keV] | X pos [asec] | Y pos [asec] | Radial [asec] | B [deg] | L [deg] | Flags |
|---|---|---|---|---|---|---|---|---|---|---|---|---|---|---|
| 5011750 | 17-Jan-2005 | 02:26:24 | 02:26:54 | 02:29:20 | 176 | 64 | 53040 | 6-12 | 316 | 293 | 431 | 13.32 | 180.53 | A0 DF P1 |
| 5011751 | 17-Jan-2005 | 02:30:32 | 02:31:50 | 02:33:16 | 164 | 76 | 61680 | 6-12 | 350 | 326 | 478 | 15.47 | 182.94 | A0 DF P1 |
| 5011727 | 17-Jan-2005 | 02:35:52 | 02:37:46 | 02:37:56 | 124 | 96 | 51552 | 6-12 | 296 | 262 | 395 | 11.35 | 178.99 | A0 DF P1 PE |
| 5011704 | 17-Jan-2005 | 03:08:44 | 03:20:10 | 03:35:40 | 1616 | 4495 | 13602183 | 50-100 | 316 | 304 | 439 | 14.01 | 180.10 | a0 a1 A3 DF P1 |
| 5011784 | 17-Jan-2005 | 03:35:40 | 03:36:50 | 03:53:16 | 1056 | 272 | 454675 | 12-25 | 308 | 296 | 427 | 13.49 | 179.39 | a0 A1 DF P1 |
| 5011729 | 17-Jan-2005 | 03:58:24 | 03:59:10 | 04:02:12 | 228 | 15 | 18073 | 12-25 | 294 | 294 | 416 | 13.34 | 178.26 | A0 DF P1 |
| Date | Start | Peak | End | Classification | B [deg] | LCM [deg] |
|---|---|---|---|---|---|---|
| 17-Jan-2005 | 02:44 | 02:59 | 03:07 | C3.9 | 15 | 20 |
| 17-Jan-2005 | 03:10 | 03:21 | 03:32 | M2.6 | 15 | 21 |

