
move the mouse pointer over that image.
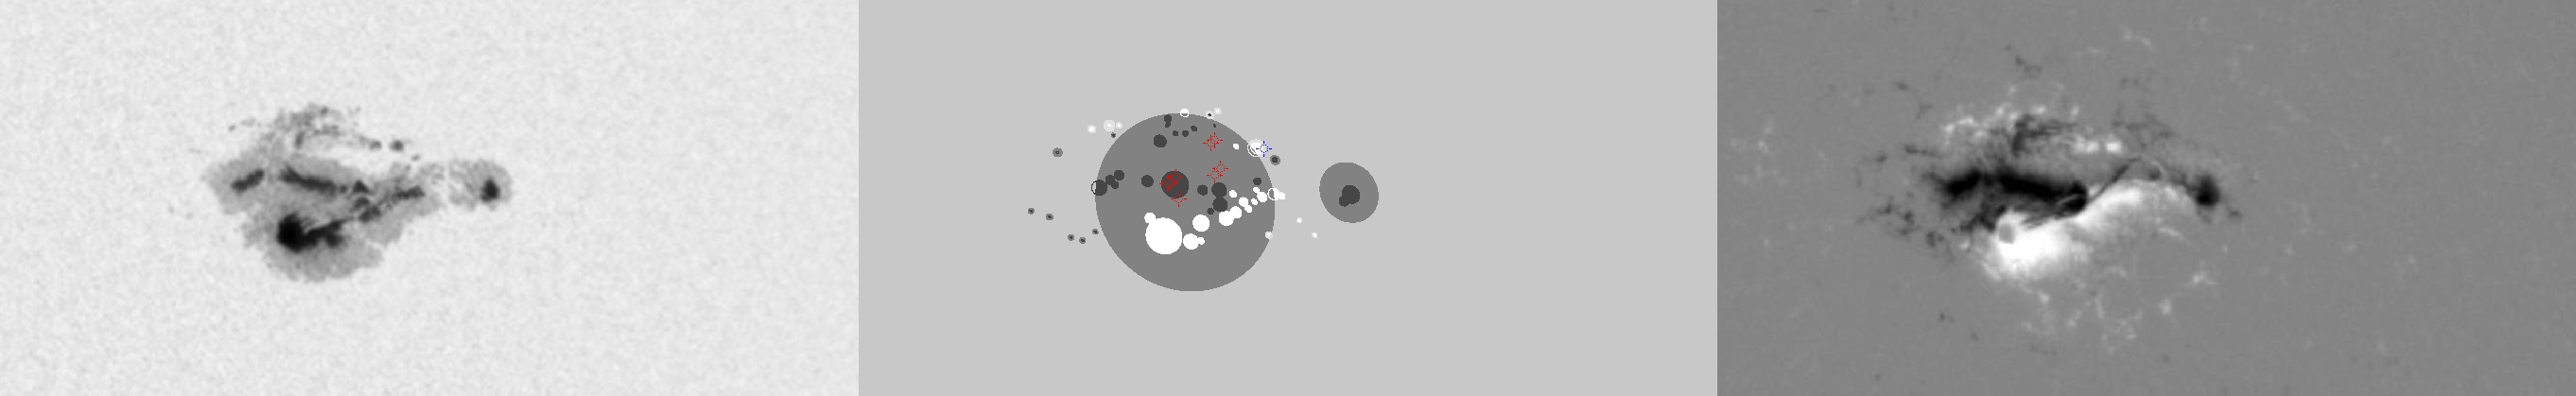
| Evolution of sunspot group NOAA 10720 and positions of flares in it animated by using the data of SOHO/MDI Debrecen Data (SDD) sunspot catalogue (lower panel, middle, ellipses with positions and areas corresponding to the relevant data of spots in SDD and with grey-scale colour coding of the magnetic polarities corresponding to that of the magnetograms), SOHO/MDI continuum images (lower panel, left) and magnetograms (lower panel, right), SOHO/EIT images (upper panel, middle), GOES and RHESSI flare data (red and blue symbols) observed within the interval around the time of SDD data. |
|
When you want to zoom in on one of the images, simply move the mouse pointer over that image. |
 |
| Year | Month | Day | Hour | Min | Sec | NOAA | Proj.U | Proj.WS | Corr.U | Corr.WS | B | L | LCM | Pos.angle | r | MU | MP |
|---|---|---|---|---|---|---|---|---|---|---|---|---|---|---|---|---|---|
| 2005 | 01 | 16 | 22 | 23 | 32 | 10720 | 659 | 4289 | 358 | 2324 | 12.71 | 180.10 | 16.28 | 317.56 | 0.4060 | -42.1 | -88.0 |
| Flare | Date | Start | Peak | End | Dur [s] | Peak [c/s] | Total Counts | Energy [keV] | X pos [asec] | Y pos [asec] | Radial [asec] | B [deg] | L [deg] | Flags |
|---|---|---|---|---|---|---|---|---|---|---|---|---|---|---|
| 5011634 | 16-Jan-2005 | 21:32:20 | 21:36:30 | 21:38:24 | 364 | 136 | 237216 | 6-12 | 272 | 302 | 406 | 13.83 | 180.39 | A0 DF P1 PE |
| 5011609 | 16-Jan-2005 | 22:12:52 | 22:19:14 | 22:47:28 | 2076 | 816 | 2185602 | 12-25 | 253 | 296 | 389 | 13.42 | 178.76 | a0 A1 DF DR P1 |
| 5011640 | 16-Jan-2005 | 22:47:28 | 22:49:42 | 22:51:40 | 252 | 6 | 4901 | 12-25 | 269 | 286 | 393 | 12.82 | 179.45 | A0 DF DR P1 |
| 5011624 | 16-Jan-2005 | 22:51:40 | 22:52:42 | 22:54:28 | 168 | 4 | 2992 | 6-12 | 268 | 300 | 402 | 13.69 | 179.42 | A0 DF DR P1 |
| 5011641 | 16-Jan-2005 | 22:54:28 | 22:55:34 | 22:58:44 | 256 | 5 | 3341 | 12-25 | 298 | 306 | 427 | 14.12 | 181.36 | A0 DF DR P1 |
| 5011642 | 16-Jan-2005 | 22:58:44 | 23:00:34 | 23:01:20 | 156 | 2 | 1320 | 6-12 | 293 | 323 | 436 | 15.18 | 181.09 | A0 DF DR P1 |
| 5011627 | 16-Jan-2005 | 23:01:20 | 23:03:02 | 23:05:36 | 256 | 2 | 2247 | 6-12 | 296 | 325 | 440 | 15.31 | 181.27 | A0 DF DR P1 |
| 5011628 | 16-Jan-2005 | 23:07:16 | 23:09:38 | 23:12:40 | 324 | 4 | 3472 | 6-12 | 269 | 297 | 401 | 13.50 | 179.32 | A0 DF P1 |
| Date | Start | Peak | End | Classification | B [deg] | LCM [deg] |
|---|---|---|---|---|---|---|
| 16-Jan-2005 | 21:55 | 22:03 | 22:22 | M2.4 | 15 | 19 |

