move the mouse pointer over that image.
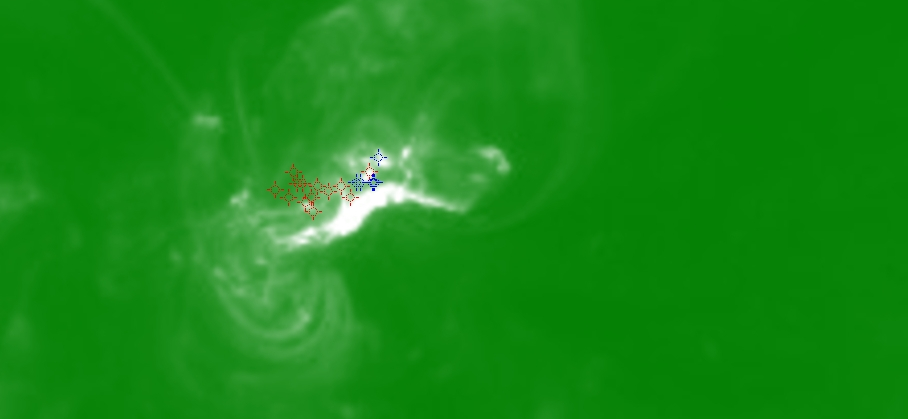
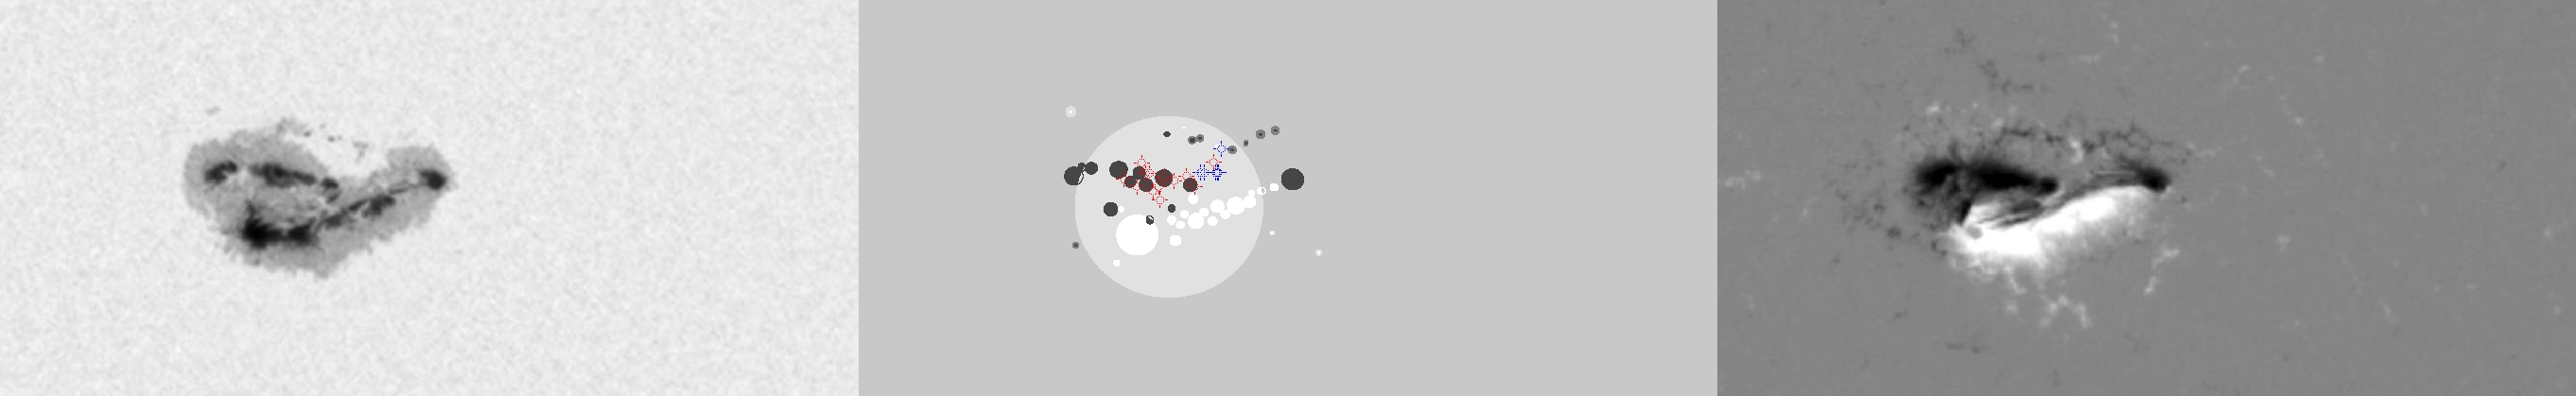
| Evolution of sunspot group NOAA 10720 and positions of flares in it animated by using the data of SOHO/MDI Debrecen Data (SDD) sunspot catalogue (lower panel, middle, ellipses with positions and areas corresponding to the relevant data of spots in SDD and with grey-scale colour coding of the magnetic polarities corresponding to that of the magnetograms), SOHO/MDI continuum images (lower panel, left) and magnetograms (lower panel, right), SOHO/EIT images (upper panel, middle), GOES and RHESSI flare data (red and blue symbols) observed within the interval around the time of SDD data. |
|
When you want to zoom in on one of the images, simply move the mouse pointer over that image. |
 |
| Year | Month | Day | Hour | Min | Sec | NOAA | Proj.U | Proj.WS | Corr.U | Corr.WS | B | L | LCM | Pos.angle | r | MU | MP |
|---|---|---|---|---|---|---|---|---|---|---|---|---|---|---|---|---|---|
| 2005 | 01 | 15 | 17 | 35 | 32 | 10720 | 691 | 4125 | 358 | 2140 | 12.64 | 179.95 | 0.33 | 358.91 | 0.2963 | 301.2 | 4.1 |
| Flare | Date | Start | Peak | End | Dur [s] | Peak [c/s] | Total Counts | Energy [keV] | X pos [asec] | Y pos [asec] | Radial [asec] | B [deg] | L [deg] | Flags |
|---|---|---|---|---|---|---|---|---|---|---|---|---|---|---|
| 5011580 | 15-Jan-2005 | 16:42:40 | 16:53:30 | 17:01:20 | 1120 | 120 | 251929 | 25-50 | 23 | 297 | 298 | 13.42 | 180.64 | a0 A1 DF EE P1 |
| 50115147 | 15-Jan-2005 | 17:25:00 | 17:25:34 | 17:26:48 | 108 | 3 | 1737 | 6-12 | 19 | 301 | 302 | 13.67 | 180.10 | A0 DF DR P1 |
| 50115112 | 15-Jan-2005 | 17:27:56 | 17:31:46 | 17:37:00 | 544 | 7 | 12553 | 6-12 | 14 | 304 | 305 | 13.86 | 179.74 | A0 DF DR P1 |
| 50115148 | 15-Jan-2005 | 17:37:52 | 17:38:10 | 17:38:40 | 48 | 3 | 825 | 6-12 | -2 | 297 | 297 | 13.42 | 178.70 | A0 DF P1 |
| 5011582 | 15-Jan-2005 | 17:42:08 | 17:43:34 | 17:46:08 | 240 | 7 | 5865 | 12-25 | 15 | 288 | 289 | 12.86 | 179.69 | A0 DF P1 |
| 5011541 | 15-Jan-2005 | 17:48:28 | 17:59:54 | 18:05:36 | 1028 | 30 | 57753 | 6-12 | 15 | 294 | 295 | 13.23 | 179.54 | A0 a1 DF DR P1 PE |
| 50115114 | 15-Jan-2005 | 18:18:32 | 18:19:58 | 18:31:36 | 784 | 26 | 48777 | 12-25 | 43 | 304 | 307 | 13.86 | 181.08 | a0 A1 DF DR P1 |
| 5011547 | 15-Jan-2005 | 19:00:00 | 19:01:06 | 19:05:48 | 348 | 13 | 14749 | 6-12 | 73 | 313 | 322 | 14.43 | 182.55 | a0 A1 DF DR P1 |
| 50115150 | 15-Jan-2005 | 19:05:48 | 19:11:38 | 19:16:48 | 660 | 52 | 34759 | 12-25 | 40 | 297 | 300 | 13.42 | 180.42 | a0 A1 DF P1 |
| 50115115 | 15-Jan-2005 | 19:16:48 | 19:21:10 | 19:29:48 | 780 | 1 | 3584 | 6-12 | 20 | 302 | 303 | 13.73 | 179.11 | A0 DF DR P1 |
| 50115116 | 15-Jan-2005 | 19:29:48 | 19:48:06 | 19:54:40 | 1492 | 48 | 62178 | 12-25 | 42 | 306 | 309 | 13.98 | 180.21 | a0 A1 DF DR P1 PE |
| 50115117 | 15-Jan-2005 | 19:54:40 | 19:55:42 | 19:59:36 | 296 | 7 | 7861 | 12-25 | 47 | 306 | 309 | 13.98 | 180.45 | A0 DF DR P1 |
| 50115118 | 15-Jan-2005 | 19:59:36 | 20:03:46 | 20:04:40 | 304 | 6 | 8201 | 12-25 | 44 | 313 | 316 | 14.42 | 180.20 | A0 DF P1 Q2 |
| Date | Start | Peak | End | Classification | B [deg] | LCM [deg] |
|---|---|---|---|---|---|---|
| 15-Jan-2005 | 16:50 | 16:57 | 17:02 | C8.0 | 14 | 02 |
| 15-Jan-2005 | 17:03 | 17:07 | 17:09 | C7.2 | 14 | 02 |
| 15-Jan-2005 | 17:49 | 18:16 | 18:24 | C4.2 | 14 | 02 |
| 15-Jan-2005 | 18:42 | 18:53 | 19:01 | C8.8 | 14 | 03 |
| 15-Jan-2005 | 19:44 | 19:49 | 19:54 | C3.5 | 14 | 03 |
| 15-Jan-2005 | 20:08 | 20:22 | 20:27 | C5.4 | 15 | 04 |

