move the mouse pointer over that image.
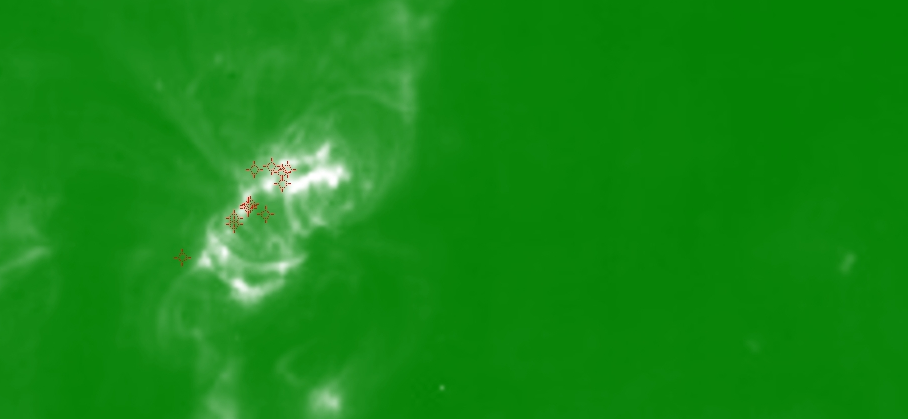
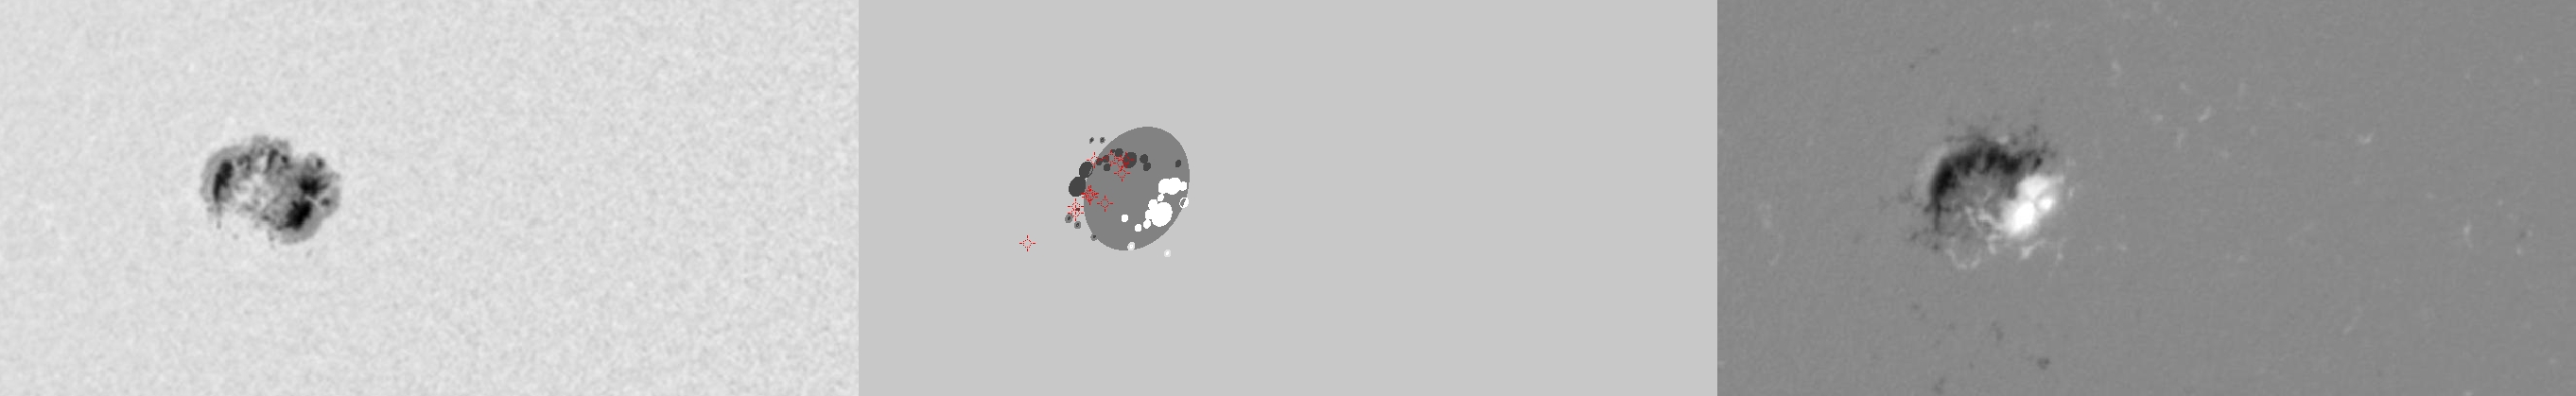
| Evolution of sunspot group NOAA 10720 and positions of flares in it animated by using the data of SOHO/MDI Debrecen Data (SDD) sunspot catalogue (lower panel, middle, ellipses with positions and areas corresponding to the relevant data of spots in SDD and with grey-scale colour coding of the magnetic polarities corresponding to that of the magnetograms), SOHO/MDI continuum images (lower panel, left) and magnetograms (lower panel, right), SOHO/EIT images (upper panel, middle), GOES and RHESSI flare data (red and blue symbols) observed within the interval around the time of SDD data. |
|
When you want to zoom in on one of the images, simply move the mouse pointer over that image. |
 |
| Year | Month | Day | Hour | Min | Sec | NOAA | Proj.U | Proj.WS | Corr.U | Corr.WS | B | L | LCM | Pos.angle | r | MU | MP |
|---|---|---|---|---|---|---|---|---|---|---|---|---|---|---|---|---|---|
| 2005 | 01 | 12 | 22 | 46 | 32 | 10720 | 279 | 1529 | 179 | 998 | 13.52 | 179.54 | -36.76 | 63.36 | 0.6530 | 169.8 | -159.9 |
| Flare | Date | Start | Peak | End | Dur [s] | Peak [c/s] | Total Counts | Energy [keV] | X pos [asec] | Y pos [asec] | Radial [asec] | B [deg] | L [deg] | Flags |
|---|---|---|---|---|---|---|---|---|---|---|---|---|---|---|
| 50112111 | 12-Jan-2005 | 20:44:28 | 20:45:02 | 20:46:36 | 128 | 24 | 15072 | 6-12 | -608 | 275 | 667 | 13.40 | 176.11 | A0 DR P1 |
| 50112112 | 12-Jan-2005 | 20:49:36 | 20:50:14 | 20:50:48 | 72 | 28 | 9120 | 6-12 | -597 | 271 | 655 | 13.10 | 177.00 | A0 |
| 5011289 | 12-Jan-2005 | 20:51:52 | 20:54:10 | 20:59:12 | 440 | 100 | 114504 | 6-12 | -592 | 301 | 664 | 14.98 | 176.98 | A0 |
| 5011290 | 12-Jan-2005 | 21:05:28 | 21:08:10 | 21:12:40 | 432 | 52 | 58608 | 6-12 | -612 | 265 | 667 | 12.78 | 175.70 | A0 DR P1 PE |
| 5011292 | 12-Jan-2005 | 21:14:52 | 21:16:22 | 21:17:56 | 184 | 48 | 19728 | 6-12 | -610 | 269 | 667 | 13.03 | 175.74 | A0 DR P1 PE |
| 50112113 | 12-Jan-2005 | 21:17:56 | 21:20:10 | 21:21:12 | 196 | 24 | 22464 | 6-12 | -599 | 278 | 661 | 13.55 | 176.48 | A0 DR P1 PE |
| 5011293 | 12-Jan-2005 | 22:21:36 | 22:22:14 | 22:24:24 | 168 | 30 | 17712 | 6-12 | -565 | 299 | 640 | 14.74 | 178.35 | A0 DR P1 |
| 50112114 | 12-Jan-2005 | 22:24:24 | 22:25:54 | 22:27:16 | 172 | 26 | 18192 | 6-12 | -561 | 301 | 637 | 14.85 | 178.60 | A0 |
| 5011219 | 12-Jan-2005 | 22:31:40 | 22:33:06 | 22:35:20 | 220 | 120 | 52488 | 12-25 | -562 | 292 | 634 | 14.29 | 178.57 | A0 |
| 50112115 | 12-Jan-2005 | 22:35:20 | 22:36:58 | 22:45:40 | 620 | 80 | 141552 | 6-12 | -624 | 246 | 671 | 11.64 | 174.13 | A0 |
| 5011294 | 12-Jan-2005 | 22:45:40 | 22:50:02 | 22:54:28 | 528 | 64 | 94152 | 6-12 | -576 | 301 | 650 | 14.91 | 177.20 | A0 DR P1 PE |
| 5011239 | 12-Jan-2005 | 22:54:28 | 22:57:50 | 23:07:52 | 804 | 84 | 170952 | 6-12 | -578 | 279 | 642 | 13.52 | 177.25 | A0 DR P1 PE |
| Date | Start | Peak | End | Classification | B [deg] | LCM [deg] |
|---|---|---|---|---|---|---|
| No data |

