move the mouse pointer over that image.
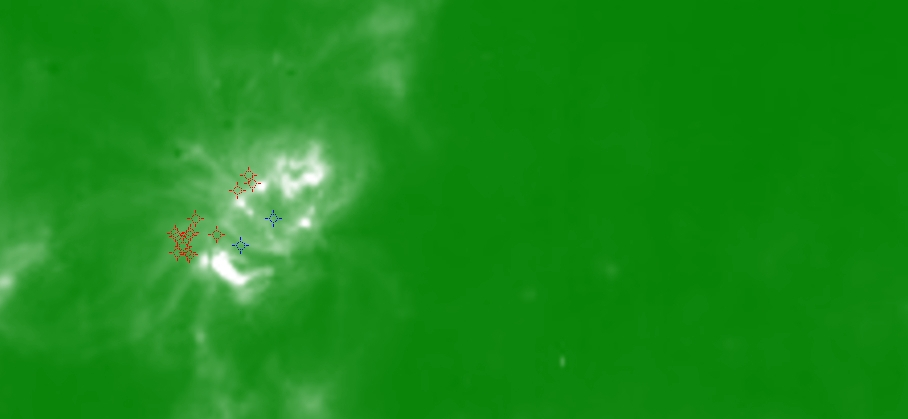
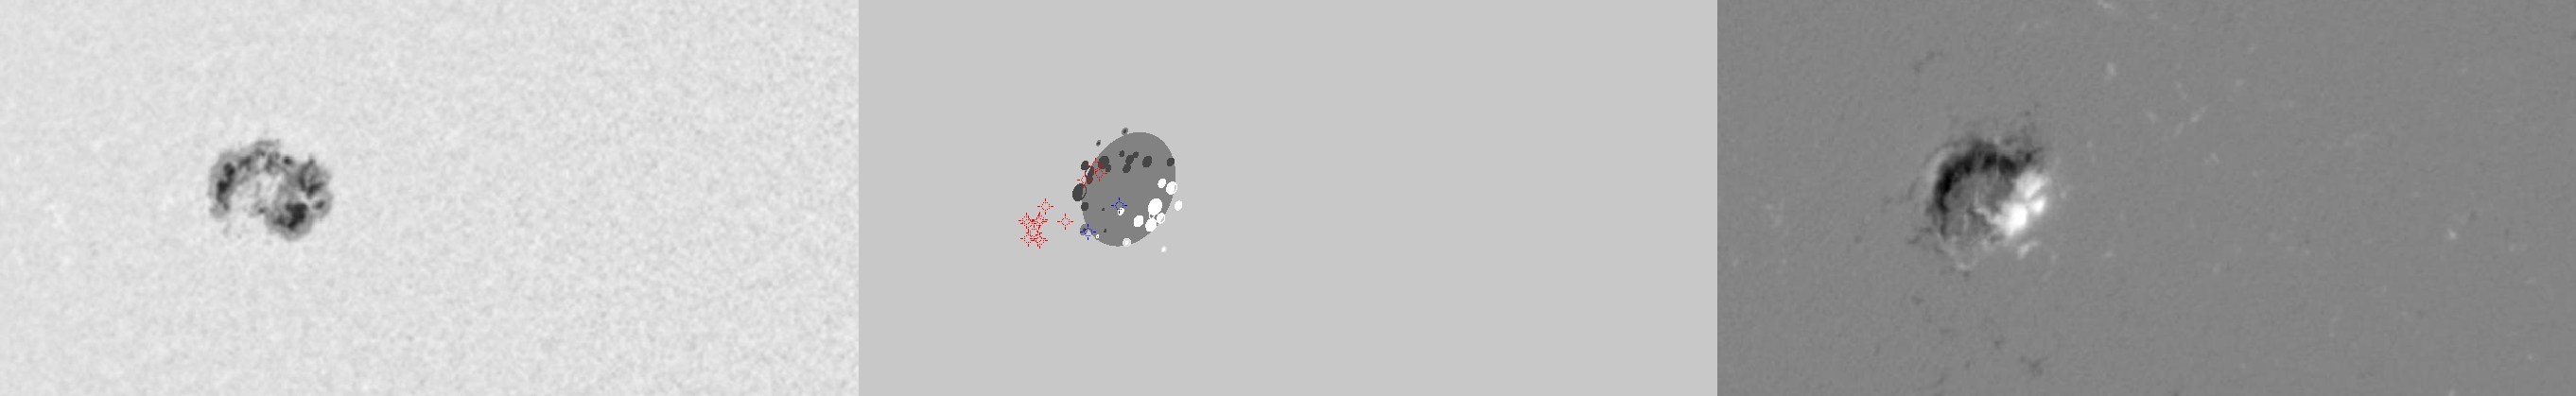
| Evolution of sunspot group NOAA 10720 and positions of flares in it animated by using the data of SOHO/MDI Debrecen Data (SDD) sunspot catalogue (lower panel, middle, ellipses with positions and areas corresponding to the relevant data of spots in SDD and with grey-scale colour coding of the magnetic polarities corresponding to that of the magnetograms), SOHO/MDI continuum images (lower panel, left) and magnetograms (lower panel, right), SOHO/EIT images (upper panel, middle), GOES and RHESSI flare data (red and blue symbols) observed within the interval around the time of SDD data. |
|
When you want to zoom in on one of the images, simply move the mouse pointer over that image. |
 |
| Year | Month | Day | Hour | Min | Sec | NOAA | Proj.U | Proj.WS | Corr.U | Corr.WS | B | L | LCM | Pos.angle | r | MU | MP |
|---|---|---|---|---|---|---|---|---|---|---|---|---|---|---|---|---|---|
| 2005 | 01 | 12 | 17 | 35 | 32 | 10720 | 205 | 1262 | 143 | 863 | 13.54 | 179.08 | -40.06 | 65.18 | 0.6914 | -104.0 | -132.1 |
| Flare | Date | Start | Peak | End | Dur [s] | Peak [c/s] | Total Counts | Energy [keV] | X pos [asec] | Y pos [asec] | Radial [asec] | B [deg] | L [deg] | Flags |
|---|---|---|---|---|---|---|---|---|---|---|---|---|---|---|
| 5011280 | 12-Jan-2005 | 16:49:28 | 16:50:34 | 16:52:48 | 200 | 40 | 29784 | 6-12 | -662 | 247 | 707 | 11.89 | 174.08 | A0 |
| 5011281 | 12-Jan-2005 | 16:54:56 | 16:55:38 | 16:56:00 | 64 | 48 | 9216 | 6-12 | -667 | 257 | 715 | 12.54 | 173.46 | A0 |
| 5011221 | 12-Jan-2005 | 17:23:12 | 17:24:18 | 17:26:56 | 224 | 92 | 64944 | 6-12 | -653 | 246 | 698 | 11.78 | 174.56 | A0 DR ES P1 PE |
| 5011283 | 12-Jan-2005 | 17:45:44 | 17:47:34 | 17:52:12 | 388 | 36 | 46694 | 6-12 | -611 | 296 | 679 | 14.75 | 177.20 | A0 DF P1 |
| 5011222 | 12-Jan-2005 | 17:59:36 | 18:03:06 | 18:05:16 | 340 | 36 | 54096 | 6-12 | -605 | 291 | 672 | 14.40 | 177.62 | A0 DR P1 PE |
| 50112108 | 12-Jan-2005 | 18:05:16 | 18:06:50 | 18:09:52 | 276 | 42 | 47424 | 6-12 | -648 | 252 | 695 | 12.13 | 174.52 | A0 DR P1 PE |
| 5011284 | 12-Jan-2005 | 18:20:20 | 18:24:34 | 18:31:20 | 660 | 46 | 100944 | 6-12 | -640 | 261 | 691 | 12.66 | 174.92 | A0 DR P1 |
| 5011285 | 12-Jan-2005 | 19:02:12 | 19:05:54 | 19:10:00 | 468 | 144 | 196656 | 6-12 | -639 | 249 | 686 | 11.90 | 174.78 | A0 DR P1 PE |
| 5011286 | 12-Jan-2005 | 19:16:16 | 19:20:10 | 19:22:00 | 344 | 48 | 55800 | 6-12 | -597 | 288 | 663 | 14.18 | 177.61 | A0 |
| 50112109 | 12-Jan-2005 | 19:46:16 | 19:48:06 | 19:50:16 | 240 | 64 | 48048 | 6-12 | -618 | 271 | 675 | 13.19 | 175.86 | A0 DR P1 PE |
| 5011287 | 12-Jan-2005 | 19:51:40 | 19:53:06 | 19:54:56 | 196 | 136 | 51552 | 6-12 | -603 | 261 | 657 | 12.50 | 177.16 | A0 DR P1 |
| 50112110 | 12-Jan-2005 | 20:02:28 | 20:02:54 | 20:03:12 | 44 | 30 | 5640 | 6-12 | -628 | 262 | 681 | 12.67 | 175.01 | A0 |
| 5011288 | 12-Jan-2005 | 20:04:00 | 20:07:38 | 20:08:12 | 252 | 92 | 54120 | 6-12 | -618 | 261 | 671 | 12.56 | 175.81 | A0 |
| Date | Start | Peak | End | Classification | B [deg] | LCM [deg] |
|---|---|---|---|---|---|---|
| 12-Jan-2005 | 17:18 | 17:22 | 17:24 | B4.1 | 12 | -42 |
| 12-Jan-2005 | 20:08 | 20:11 | 20:13 | B4.6 | 13 | -39 |

