move the mouse pointer over that image.
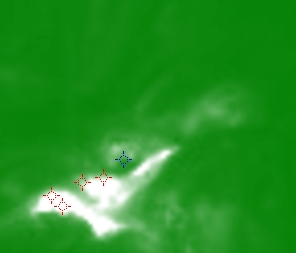
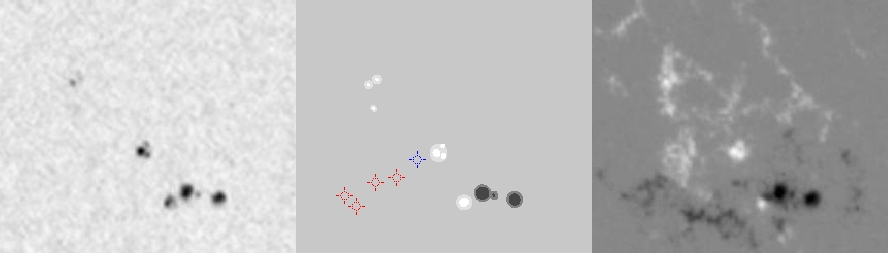
| Evolution of sunspot group NOAA 10715 and positions of flares in it animated by using the data of SOHO/MDI Debrecen Data (SDD) sunspot catalogue (lower panel, middle, ellipses with positions and areas corresponding to the relevant data of spots in SDD and with grey-scale colour coding of the magnetic polarities corresponding to that of the magnetograms), SOHO/MDI continuum images (lower panel, left) and magnetograms (lower panel, right), SOHO/EIT images (upper panel, middle), GOES and RHESSI flare data (red and blue symbols) observed within the interval around the time of SDD data. |
|
When you want to zoom in on one of the images, simply move the mouse pointer over that image. |
 |
| Year | Month | Day | Hour | Min | Sec | NOAA | Proj.U | Proj.WS | Corr.U | Corr.WS | B | L | LCM | Pos.angle | r | MU | MP |
|---|---|---|---|---|---|---|---|---|---|---|---|---|---|---|---|---|---|
| 2005 | 01 | 04 | 11 | 00 | 32 | 10715 | 44 | 134 | 22 | 69 | 4.50 | 340.73 | 12.57 | 302.29 | 0.2595 | -651.9 | -131.5 |
| Flare | Date | Start | Peak | End | Dur [s] | Peak [c/s] | Total Counts | Energy [keV] | X pos [asec] | Y pos [asec] | Radial [asec] | B [deg] | L [deg] | Flags |
|---|---|---|---|---|---|---|---|---|---|---|---|---|---|---|
| 5010417 | 4-Jan-2005 | 07:11:40 | 07:12:26 | 07:15:16 | 216 | 18 | 20544 | 6-12 | 81 | 116 | 141 | 3.62 | 334.24 | A0 |
| 5010418 | 4-Jan-2005 | 10:18:44 | 10:22:46 | 10:25:20 | 396 | 24 | 44664 | 6-12 | 171 | 127 | 213 | 4.31 | 337.92 | A0 DF P1 |
| 5010405 | 4-Jan-2005 | 11:05:56 | 11:06:46 | 11:15:16 | 560 | 272 | 598719 | 12-25 | 171 | 124 | 212 | 4.13 | 337.51 | a0 A1 DF ES GE P1 PE |
| 5010419 | 4-Jan-2005 | 11:55:20 | 11:56:58 | 12:05:32 | 612 | 13 | 35033 | 6-12 | 174 | 109 | 205 | 3.22 | 337.22 | a0 A1 DF P1 |
| Date | Start | Peak | End | Classification | B [deg] | LCM [deg] |
|---|---|---|---|---|---|---|
| 4-Jan-2005 | 10:53 | 11:13 | 11:29 | C7.3 | 05 | 11 |

