move the mouse pointer over that image.
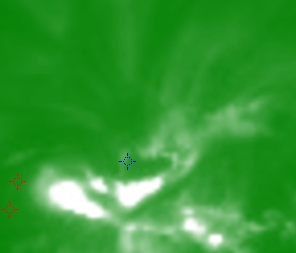
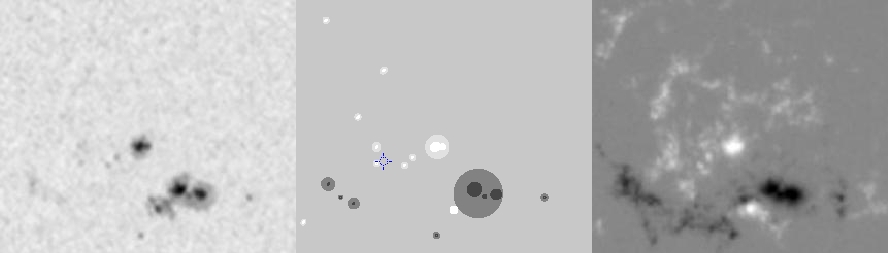
| Evolution of sunspot group NOAA 10715 and positions of flares in it animated by using the data of SOHO/MDI Debrecen Data (SDD) sunspot catalogue (lower panel, middle, ellipses with positions and areas corresponding to the relevant data of spots in SDD and with grey-scale colour coding of the magnetic polarities corresponding to that of the magnetograms), SOHO/MDI continuum images (lower panel, left) and magnetograms (lower panel, right), SOHO/EIT images (upper panel, middle), GOES and RHESSI flare data (red and blue symbols) observed within the interval around the time of SDD data. |
|
When you want to zoom in on one of the images, simply move the mouse pointer over that image. |
 |
| Year | Month | Day | Hour | Min | Sec | NOAA | Proj.U | Proj.WS | Corr.U | Corr.WS | B | L | LCM | Pos.angle | r | MU | MP |
|---|---|---|---|---|---|---|---|---|---|---|---|---|---|---|---|---|---|
| 2005 | 01 | 03 | 01 | 35 | 32 | 10715 | 54 | 381 | 28 | 192 | 4.20 | 340.57 | -5.95 | 37.85 | 0.1675 | -462.5 | -166.7 |
| Flare | Date | Start | Peak | End | Dur [s] | Peak [c/s] | Total Counts | Energy [keV] | X pos [asec] | Y pos [asec] | Radial [asec] | B [deg] | L [deg] | Flags |
|---|---|---|---|---|---|---|---|---|---|---|---|---|---|---|
| 5010351 | 3-Jan-2005 | 03:46:04 | 04:07:10 | 04:07:52 | 1308 | 1328 | 2049360 | 12-25 | -151 | 124 | 195 | 4.26 | 335.22 | A0 DF DR EE P1 PE |
| 5010313 | 3-Jan-2005 | 05:00:24 | 05:00:30 | 05:22:48 | 1344 | 224 | 970080 | 6-12 | -140 | 107 | 176 | 3.23 | 335.41 | A0 DF DR GS P1 PE |
| Date | Start | Peak | End | Classification | B [deg] | LCM [deg] |
|---|---|---|---|---|---|---|
| 3-Jan-2005 | 04:02 | 04:22 | 04:48 | C3.8 | 05 | -07 |

