move the mouse pointer over that image.
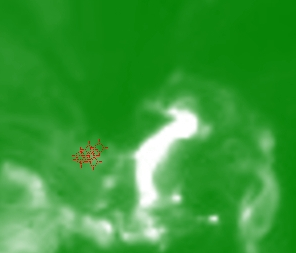
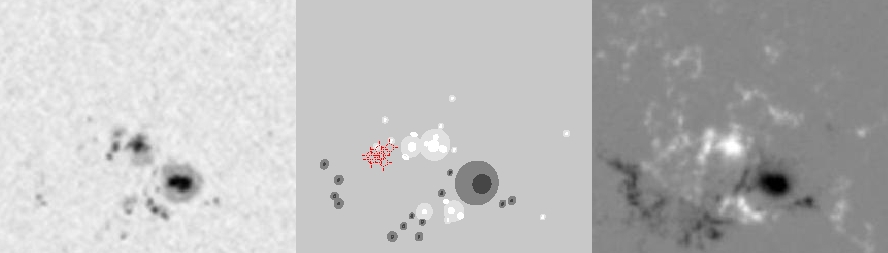
| Evolution of sunspot group NOAA 10715 and positions of flares in it animated by using the data of SOHO/MDI Debrecen Data (SDD) sunspot catalogue (lower panel, middle, ellipses with positions and areas corresponding to the relevant data of spots in SDD and with grey-scale colour coding of the magnetic polarities corresponding to that of the magnetograms), SOHO/MDI continuum images (lower panel, left) and magnetograms (lower panel, right), SOHO/EIT images (upper panel, middle), GOES and RHESSI flare data (red and blue symbols) observed within the interval around the time of SDD data. |
|
When you want to zoom in on one of the images, simply move the mouse pointer over that image. |
 |
| Year | Month | Day | Hour | Min | Sec | NOAA | Proj.U | Proj.WS | Corr.U | Corr.WS | B | L | LCM | Pos.angle | r | MU | MP |
|---|---|---|---|---|---|---|---|---|---|---|---|---|---|---|---|---|---|
| 2005 | 01 | 02 | 04 | 47 | 32 | 10715 | 84 | 529 | 43 | 281 | 4.32 | 340.47 | -17.47 | 66.92 | 0.3270 | -98.0 | -38.9 |
| Flare | Date | Start | Peak | End | Dur [s] | Peak [c/s] | Total Counts | Energy [keV] | X pos [asec] | Y pos [asec] | Radial [asec] | B [deg] | L [deg] | Flags |
|---|---|---|---|---|---|---|---|---|---|---|---|---|---|---|
| 5010242 | 2-Jan-2005 | 06:42:08 | 06:42:54 | 06:44:08 | 120 | 56 | 35184 | 6-12 | -276 | 142 | 311 | 5.54 | 339.28 | A0 DF DR GS P1 |
| 5010266 | 2-Jan-2005 | 06:44:08 | 06:48:06 | 06:55:28 | 680 | 68 | 208176 | 6-12 | -278 | 133 | 309 | 5.00 | 339.12 | A0 DF DR P1 |
| 5010267 | 2-Jan-2005 | 06:55:28 | 06:58:18 | 07:02:04 | 396 | 64 | 104064 | 6-12 | -277 | 137 | 309 | 5.24 | 339.09 | A0 DF P1 |
| 5010243 | 2-Jan-2005 | 07:02:04 | 07:03:34 | 07:05:32 | 208 | 48 | 49536 | 6-12 | -282 | 137 | 314 | 5.24 | 338.73 | A0 DF P1 |
| 5010268 | 2-Jan-2005 | 07:05:32 | 07:07:22 | 07:13:32 | 480 | 48 | 116448 | 6-12 | -275 | 141 | 309 | 5.47 | 339.12 | A0 DF P1 |
| 5010269 | 2-Jan-2005 | 07:13:32 | 07:15:02 | 07:19:36 | 364 | 44 | 66816 | 6-12 | -278 | 135 | 309 | 5.12 | 338.87 | A0 DF P1 |
| Date | Start | Peak | End | Classification | B [deg] | LCM [deg] |
|---|---|---|---|---|---|---|
| No data |

