move the mouse pointer over that image.
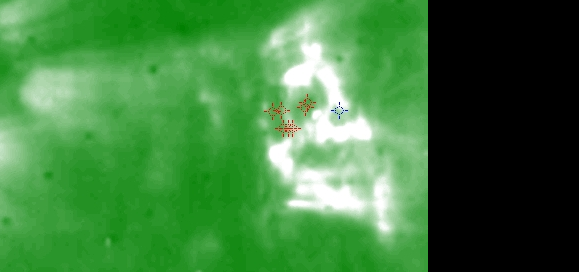
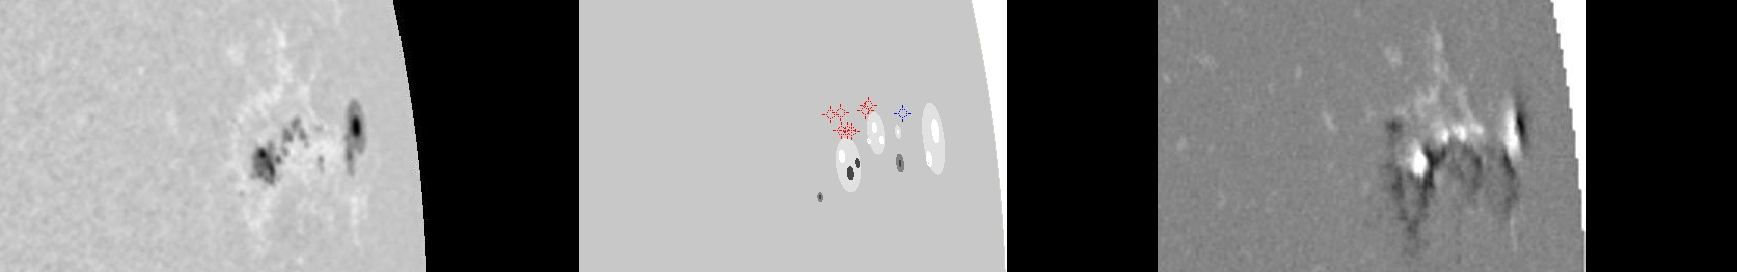
| Evolution of sunspot group NOAA 10696 and positions of flares in it animated by using the data of SOHO/MDI Debrecen Data (SDD) sunspot catalogue (lower panel, middle, ellipses with positions and areas corresponding to the relevant data of spots in SDD and with grey-scale colour coding of the magnetic polarities corresponding to that of the magnetograms), SOHO/MDI continuum images (lower panel, left) and magnetograms (lower panel, right), SOHO/EIT images (upper panel, middle), GOES and RHESSI flare data (red and blue symbols) observed within the interval around the time of SDD data. |
|
When you want to zoom in on one of the images, simply move the mouse pointer over that image. |
 |
| Year | Month | Day | Hour | Min | Sec | NOAA | Proj.U | Proj.WS | Corr.U | Corr.WS | B | L | LCM | Pos.angle | r | MU | MP |
|---|---|---|---|---|---|---|---|---|---|---|---|---|---|---|---|---|---|
| 2004 | 11 | 11 | 09 | 35 | 32 | 10696 | 50 | 382 | 72 | 544 | 7.92 | 30.74 | 69.87 | 277.28 | 0.9365 | 135.2 | 130.8 |
| Flare | Date | Start | Peak | End | Dur [s] | Peak [c/s] | Total Counts | Energy [keV] | X pos [asec] | Y pos [asec] | Radial [asec] | B [deg] | L [deg] | Flags |
|---|---|---|---|---|---|---|---|---|---|---|---|---|---|---|
| 4111148 | 11-Nov-2004 | 10:08:12 | 10:10:58 | 10:13:04 | 292 | 42 | 37704 | 6-12 | 873 | 122 | 881 | 8.62 | 386.11 | A0 DF P1 PE |
| 4111164 | 11-Nov-2004 | 10:13:04 | 10:16:34 | 10:22:04 | 540 | 52 | 79632 | 6-12 | 876 | 122 | 885 | 8.60 | 386.52 | A0 DF P1 |
| 4111151 | 11-Nov-2004 | 11:48:44 | 11:49:34 | 11:51:16 | 152 | 18 | 11256 | 6-12 | 880 | 135 | 890 | 9.33 | 386.60 | A0 DF P1 |
| 4111165 | 11-Nov-2004 | 11:51:16 | 11:52:14 | 11:53:48 | 152 | 14 | 10560 | 6-12 | 875 | 134 | 885 | 9.31 | 385.76 | A0 DF P1 |
| 4111105 | 11-Nov-2004 | 11:56:32 | 11:59:54 | 12:06:08 | 576 | 200 | 355776 | 12-25 | 882 | 124 | 891 | 8.66 | 386.57 | A0 DF P1 |
| 4111166 | 11-Nov-2004 | 12:06:08 | 12:07:58 | 12:12:12 | 364 | 68 | 89376 | 6-12 | 895 | 137 | 905 | 9.31 | 389.04 | A0 DF P1 |
| 4111152 | 11-Nov-2004 | 12:12:12 | 12:14:34 | 12:15:44 | 212 | 288 | 118872 | 12-25 | 897 | 140 | 908 | 9.47 | 389.43 | A0 DF EE P1 |
| Date | Start | Peak | End | Classification | B [deg] | LCM [deg] |
|---|---|---|---|---|---|---|
| 11-Nov-2004 | 11:56 | 12:16 | 12:24 | B6.8 | 09 | 72 |

