move the mouse pointer over that image.
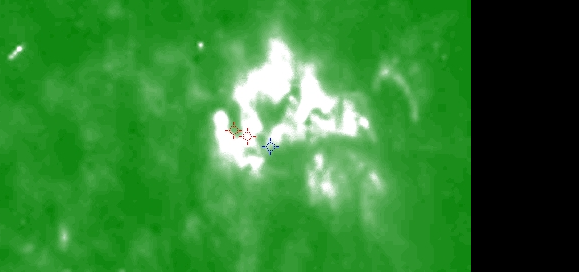
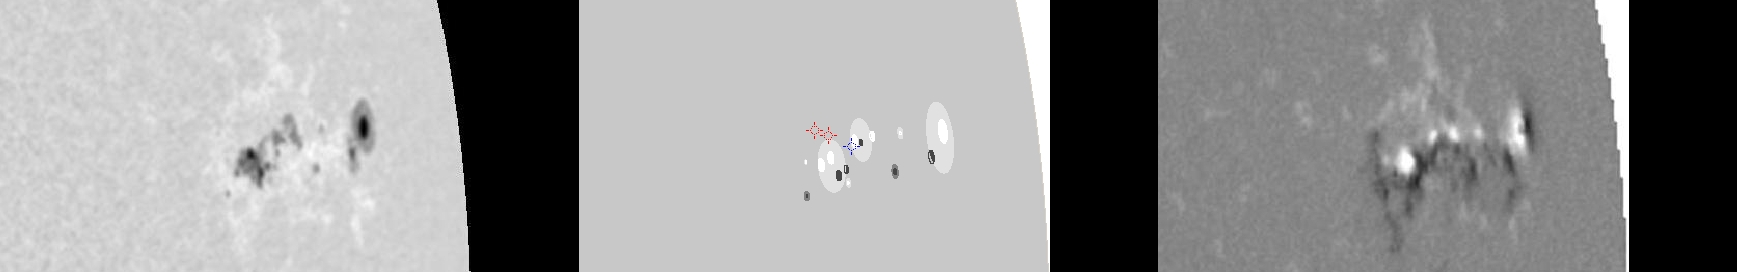
| Evolution of sunspot group NOAA 10696 and positions of flares in it animated by using the data of SOHO/MDI Debrecen Data (SDD) sunspot catalogue (lower panel, middle, ellipses with positions and areas corresponding to the relevant data of spots in SDD and with grey-scale colour coding of the magnetic polarities corresponding to that of the magnetograms), SOHO/MDI continuum images (lower panel, left) and magnetograms (lower panel, right), SOHO/EIT images (upper panel, middle), GOES and RHESSI flare data (red and blue symbols) observed within the interval around the time of SDD data. |
|
When you want to zoom in on one of the images, simply move the mouse pointer over that image. |
 |
| Year | Month | Day | Hour | Min | Sec | NOAA | Proj.U | Proj.WS | Corr.U | Corr.WS | B | L | LCM | Pos.angle | r | MU | MP |
|---|---|---|---|---|---|---|---|---|---|---|---|---|---|---|---|---|---|
| 2004 | 11 | 11 | 01 | 35 | 32 | 10696 | 74 | 461 | 86 | 541 | 7.91 | 30.47 | 65.21 | 277.24 | 0.9054 | 247.8 | 94.5 |
| Flare | Date | Start | Peak | End | Dur [s] | Peak [c/s] | Total Counts | Energy [keV] | X pos [asec] | Y pos [asec] | Radial [asec] | B [deg] | L [deg] | Flags |
|---|---|---|---|---|---|---|---|---|---|---|---|---|---|---|
| 4111136 | 11-Nov-2004 | 02:18:28 | 02:20:38 | 02:22:12 | 224 | 14 | 11026 | 6-12 | 838 | 115 | 845 | 8.48 | 385.46 | A0 DF P1 |
| 4111108 | 11-Nov-2004 | 02:28:08 | 02:34:46 | 02:39:52 | 704 | 475 | 611932 | 6-12 | 832 | 119 | 841 | 8.75 | 384.65 | A0 DF DR P1 PE |
| Date | Start | Peak | End | Classification | B [deg] | LCM [deg] |
|---|---|---|---|---|---|---|
| 11-Nov-2004 | 02:29 | 02:35 | 02:43 | B6.9 | 08 | 62 |

