move the mouse pointer over that image.
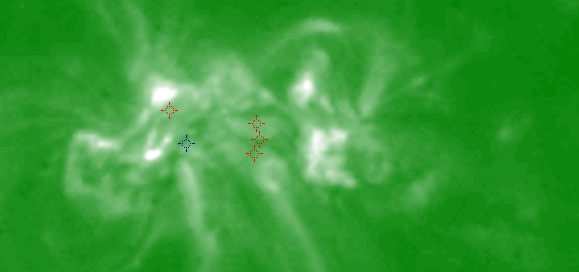
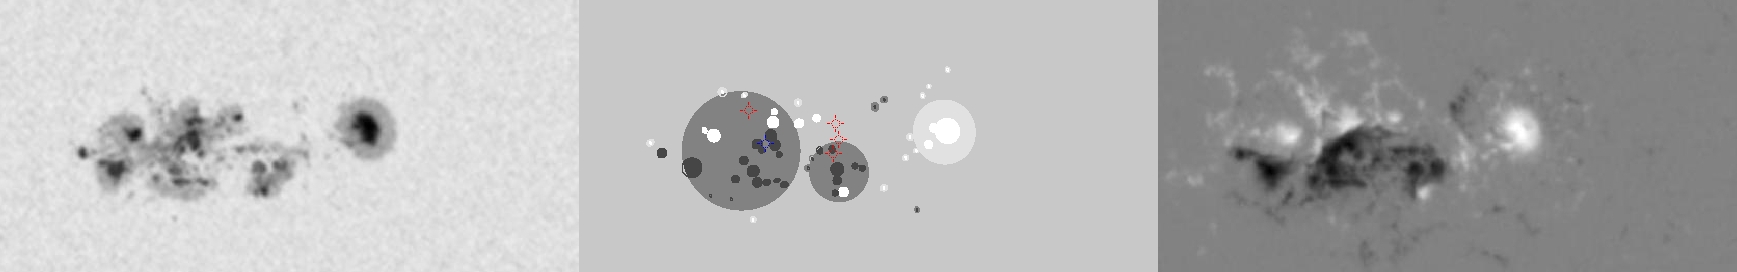
| Evolution of sunspot group NOAA 10696 and positions of flares in it animated by using the data of SOHO/MDI Debrecen Data (SDD) sunspot catalogue (lower panel, middle, ellipses with positions and areas corresponding to the relevant data of spots in SDD and with grey-scale colour coding of the magnetic polarities corresponding to that of the magnetograms), SOHO/MDI continuum images (lower panel, left) and magnetograms (lower panel, right), SOHO/EIT images (upper panel, middle), GOES and RHESSI flare data (red and blue symbols) observed within the interval around the time of SDD data. |
|
When you want to zoom in on one of the images, simply move the mouse pointer over that image. |
 |
| Year | Month | Day | Hour | Min | Sec | NOAA | Proj.U | Proj.WS | Corr.U | Corr.WS | B | L | LCM | Pos.angle | r | MU | MP |
|---|---|---|---|---|---|---|---|---|---|---|---|---|---|---|---|---|---|
| 2004 | 11 | 07 | 06 | 23 | 32 | 10696 | 341 | 2364 | 172 | 1200 | 7.72 | 27.53 | 12.17 | 290.01 | 0.2225 | -232.0 | -85.4 |
| Flare | Date | Start | Peak | End | Dur [s] | Peak [c/s] | Total Counts | Energy [keV] | X pos [asec] | Y pos [asec] | Radial [asec] | B [deg] | L [deg] | Flags |
|---|---|---|---|---|---|---|---|---|---|---|---|---|---|---|
| 4110764 | 7-Nov-2004 | 05:50:16 | 05:52:22 | 05:53:20 | 184 | 52 | 30000 | 6-12 | 182 | 93 | 205 | 9.27 | 25.47 | A0 DF DR P1 |
| 4110744 | 7-Nov-2004 | 06:54:12 | 06:55:58 | 06:56:28 | 136 | 28 | 14136 | 6-12 | 257 | 75 | 268 | 8.12 | 29.48 | A0 DF DR P1 |
| 4110767 | 7-Nov-2004 | 06:57:00 | 06:57:30 | 06:58:04 | 64 | 28 | 8040 | 6-12 | 254 | 66 | 263 | 7.59 | 29.26 | A0 DF DR P1 |
| 4110711 | 7-Nov-2004 | 07:01:40 | 07:09:34 | 07:11:24 | 584 | 168 | 249408 | 12-25 | 259 | 85 | 273 | 8.71 | 29.51 | A0 DF P1 |
| Date | Start | Peak | End | Classification | B [deg] | LCM [deg] |
|---|---|---|---|---|---|---|
| 7-Nov-2004 | 06:22 | 06:25 | 06:33 | C1.0 | 08 | 11 |

