
move the mouse pointer over that image.
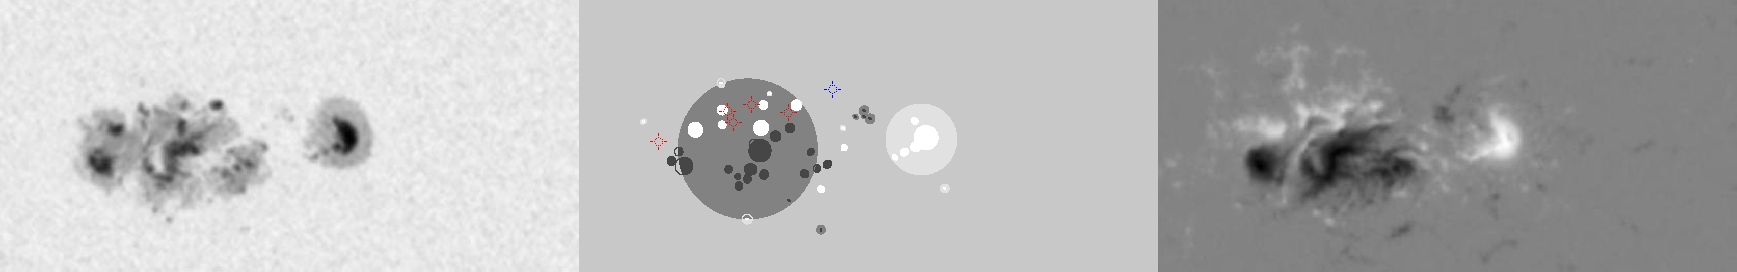
| Evolution of sunspot group NOAA 10696 and positions of flares in it animated by using the data of SOHO/MDI Debrecen Data (SDD) sunspot catalogue (lower panel, middle, ellipses with positions and areas corresponding to the relevant data of spots in SDD and with grey-scale colour coding of the magnetic polarities corresponding to that of the magnetograms), SOHO/MDI continuum images (lower panel, left) and magnetograms (lower panel, right), SOHO/EIT images (upper panel, middle), GOES and RHESSI flare data (red and blue symbols) observed within the interval around the time of SDD data. |
|
When you want to zoom in on one of the images, simply move the mouse pointer over that image. |
 |
| Year | Month | Day | Hour | Min | Sec | NOAA | Proj.U | Proj.WS | Corr.U | Corr.WS | B | L | LCM | Pos.angle | r | MU | MP |
|---|---|---|---|---|---|---|---|---|---|---|---|---|---|---|---|---|---|
| 2004 | 11 | 06 | 11 | 25 | 32 | 10696 | 383 | 2670 | 191 | 1329 | 7.83 | 27.40 | 1.62 | 338.63 | 0.0768 | -295.4 | -144.3 |
| Flare | Date | Start | Peak | End | Dur [s] | Peak [c/s] | Total Counts | Energy [keV] | X pos [asec] | Y pos [asec] | Radial [asec] | B [deg] | L [deg] | Flags |
|---|---|---|---|---|---|---|---|---|---|---|---|---|---|---|
| 4110605 | 6-Nov-2004 | 10:27:48 | 10:32:54 | 10:40:56 | 788 | 416 | 696992 | 12-25 | 34 | 88 | 95 | 9.12 | 27.09 | A0 DF P1 |
| 4110622 | 6-Nov-2004 | 11:24:20 | 11:25:58 | 11:26:48 | 148 | 20 | 13848 | 6-12 | 27 | 93 | 97 | 9.42 | 26.19 | A0 DF P1 PE |
| 4110679 | 6-Nov-2004 | 11:52:44 | 11:52:50 | 11:53:04 | 20 | 22 | 2496 | 6-12 | -23 | 70 | 74 | 8.04 | 22.93 | A0 DF P1 |
| 4110647 | 6-Nov-2004 | 11:55:04 | 11:55:54 | 11:57:20 | 136 | 28 | 19296 | 6-12 | 21 | 89 | 91 | 9.18 | 25.55 | A0 DF P1 |
| 4110680 | 6-Nov-2004 | 12:03:32 | 12:03:58 | 12:06:08 | 156 | 34 | 18552 | 6-12 | 27 | 82 | 87 | 8.76 | 25.84 | A0 DF P1 |
| Date | Start | Peak | End | Classification | B [deg] | LCM [deg] |
|---|---|---|---|---|---|---|
| 6-Nov-2004 | 10:29 | 10:33 | 10:38 | B6.8 | 10 | 03 |

