move the mouse pointer over that image.
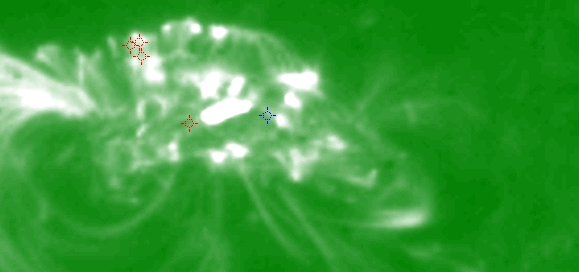
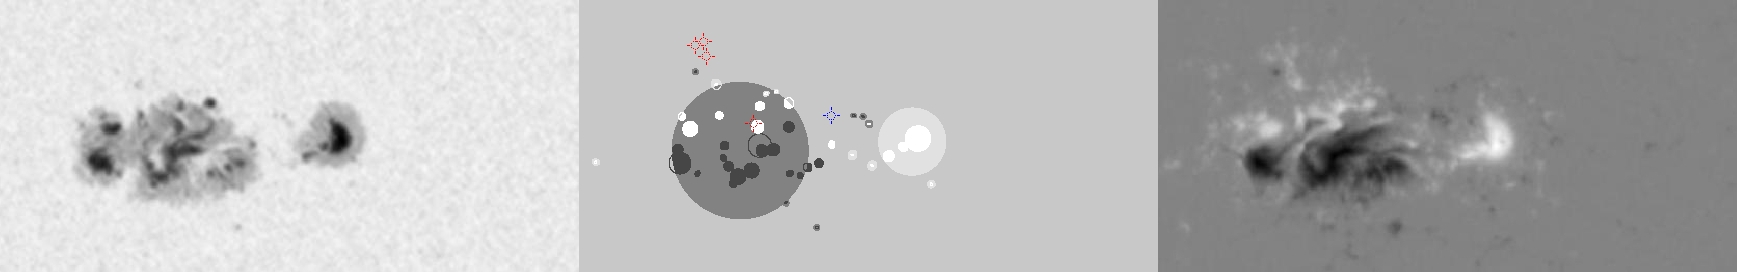
| Evolution of sunspot group NOAA 10696 and positions of flares in it animated by using the data of SOHO/MDI Debrecen Data (SDD) sunspot catalogue (lower panel, middle, ellipses with positions and areas corresponding to the relevant data of spots in SDD and with grey-scale colour coding of the magnetic polarities corresponding to that of the magnetograms), SOHO/MDI continuum images (lower panel, left) and magnetograms (lower panel, right), SOHO/EIT images (upper panel, middle), GOES and RHESSI flare data (red and blue symbols) observed within the interval around the time of SDD data. |
|
When you want to zoom in on one of the images, simply move the mouse pointer over that image. |
 |
| Year | Month | Day | Hour | Min | Sec | NOAA | Proj.U | Proj.WS | Corr.U | Corr.WS | B | L | LCM | Pos.angle | r | MU | MP |
|---|---|---|---|---|---|---|---|---|---|---|---|---|---|---|---|---|---|
| 2004 | 11 | 06 | 05 | 58 | 32 | 10696 | 440 | 2522 | 218 | 1253 | 7.77 | 27.11 | -1.67 | 22.50 | 0.0757 | -506.2 | -138.6 |
| Flare | Date | Start | Peak | End | Dur [s] | Peak [c/s] | Total Counts | Energy [keV] | X pos [asec] | Y pos [asec] | Radial [asec] | B [deg] | L [deg] | Flags |
|---|---|---|---|---|---|---|---|---|---|---|---|---|---|---|
| 4110636 | 6-Nov-2004 | 05:11:20 | 05:12:50 | 05:16:44 | 324 | 96 | 167520 | 6-12 | -71 | 130 | 148 | 11.65 | 23.66 | A0 DF DR GS P1 |
| 4110676 | 6-Nov-2004 | 05:16:44 | 05:26:58 | 05:43:40 | 1616 | 96 | 755712 | 6-12 | -60 | 123 | 137 | 11.24 | 24.21 | A0 DF DR P1 |
| 4110677 | 6-Nov-2004 | 05:43:40 | 05:45:30 | 05:53:36 | 596 | 84 | 224856 | 6-12 | -56 | 132 | 144 | 11.77 | 24.27 | A0 DF DR P1 |
| 4110620 | 6-Nov-2004 | 06:53:28 | 06:57:22 | 07:00:40 | 432 | 28 | 17171 | 12-25 | -3 | 81 | 81 | 8.72 | 26.84 | a0 A1 DF DR P1 |
| Date | Start | Peak | End | Classification | B [deg] | LCM [deg] |
|---|---|---|---|---|---|---|
| 6-Nov-2004 | 06:54 | 06:58 | 07:00 | C1.8 | 09 | 01 |

