move the mouse pointer over that image.
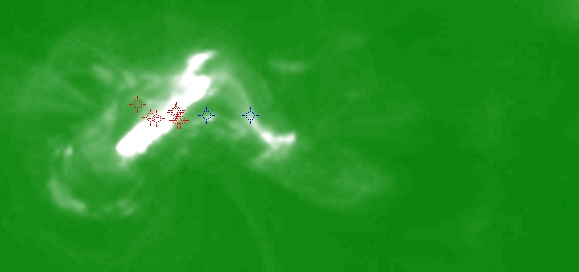
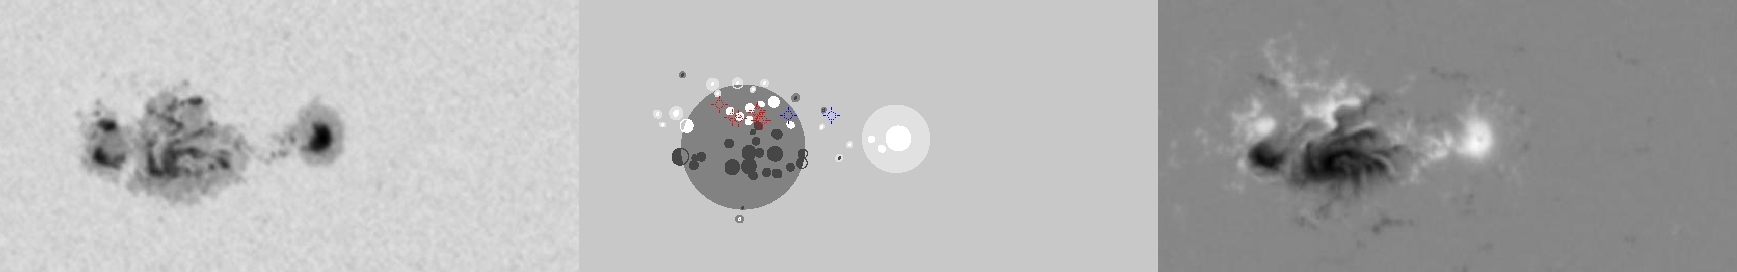
| Evolution of sunspot group NOAA 10696 and positions of flares in it animated by using the data of SOHO/MDI Debrecen Data (SDD) sunspot catalogue (lower panel, middle, ellipses with positions and areas corresponding to the relevant data of spots in SDD and with grey-scale colour coding of the magnetic polarities corresponding to that of the magnetograms), SOHO/MDI continuum images (lower panel, left) and magnetograms (lower panel, right), SOHO/EIT images (upper panel, middle), GOES and RHESSI flare data (red and blue symbols) observed within the interval around the time of SDD data. |
|
When you want to zoom in on one of the images, simply move the mouse pointer over that image. |
 |
| Year | Month | Day | Hour | Min | Sec | NOAA | Proj.U | Proj.WS | Corr.U | Corr.WS | B | L | LCM | Pos.angle | r | MU | MP |
|---|---|---|---|---|---|---|---|---|---|---|---|---|---|---|---|---|---|
| 2004 | 11 | 05 | 17 | 35 | 32 | 10696 | 374 | 2209 | 187 | 1110 | 7.87 | 27.29 | -8.29 | 60.96 | 0.1629 | -516.4 | -208.3 |
| Flare | Date | Start | Peak | End | Dur [s] | Peak [c/s] | Total Counts | Energy [keV] | X pos [asec] | Y pos [asec] | Radial [asec] | B [deg] | L [deg] | Flags |
|---|---|---|---|---|---|---|---|---|---|---|---|---|---|---|
| 4110518 | 5-Nov-2004 | 16:50:40 | 16:51:10 | 16:53:44 | 184 | 64 | 57397 | 6-12 | -143 | 87 | 167 | 9.10 | 26.12 | A0 DF GS P1 |
| 4110596 | 5-Nov-2004 | 16:53:44 | 16:56:06 | 16:58:48 | 304 | 102 | 108740 | 6-12 | -141 | 88 | 167 | 9.16 | 26.20 | A0 DF P1 |
| 4110597 | 5-Nov-2004 | 16:58:48 | 17:03:10 | 17:04:00 | 312 | 73 | 109123 | 6-12 | -151 | 83 | 173 | 8.86 | 25.53 | A0 DF P1 |
| 4110598 | 5-Nov-2004 | 17:04:00 | 17:05:34 | 17:06:08 | 128 | 460 | 60616 | 6-12 | -154 | 84 | 176 | 8.91 | 25.32 | A0 DF P1 |
| 4110599 | 5-Nov-2004 | 17:44:40 | 17:46:14 | 17:52:52 | 492 | 120 | 108912 | 6-12 | -123 | 82 | 148 | 8.81 | 26.84 | A0 DF DR P1 |
| 4110519 | 5-Nov-2004 | 17:54:20 | 17:57:02 | 18:02:44 | 504 | 784 | 920568 | 12-25 | -122 | 82 | 148 | 8.81 | 26.80 | A0 DF DR P1 |
| 41105100 | 5-Nov-2004 | 18:02:44 | 18:13:38 | 18:13:48 | 664 | 1776 | 1187232 | 12-25 | -142 | 92 | 170 | 9.39 | 25.42 | A0 a1 DF GE P1 PE |
| Date | Start | Peak | End | Classification | B [deg] | LCM [deg] |
|---|---|---|---|---|---|---|
| 5-Nov-2004 | 17:04 | 17:20 | 17:25 | C9.0 | 09 | -08 |
| 5-Nov-2004 | 17:54 | 17:58 | 18:01 | C1.2 | 09 | -06 |

