move the mouse pointer over that image.
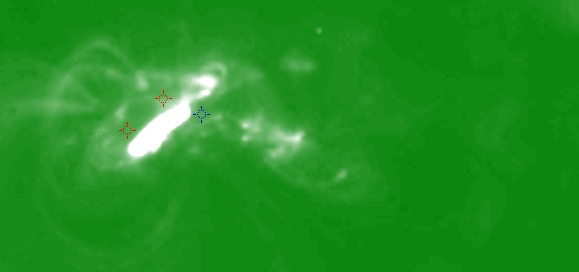
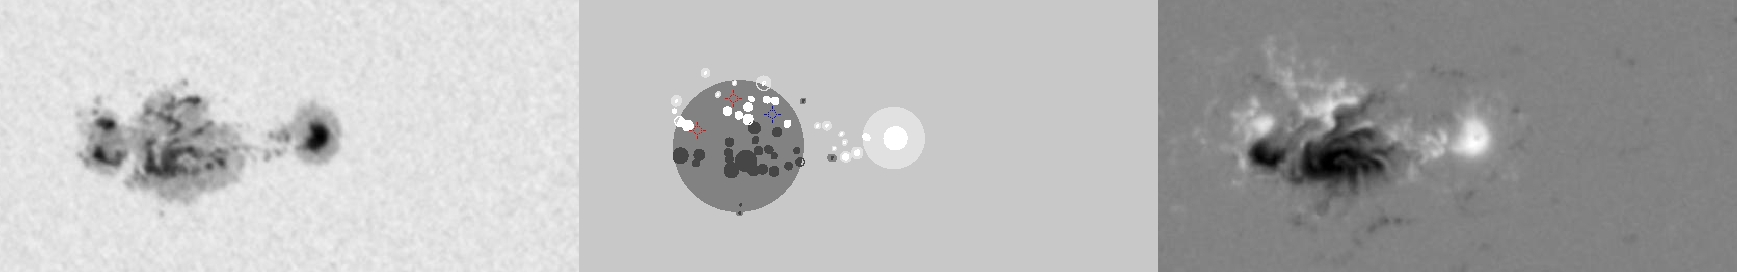
| Evolution of sunspot group NOAA 10696 and positions of flares in it animated by using the data of SOHO/MDI Debrecen Data (SDD) sunspot catalogue (lower panel, middle, ellipses with positions and areas corresponding to the relevant data of spots in SDD and with grey-scale colour coding of the magnetic polarities corresponding to that of the magnetograms), SOHO/MDI continuum images (lower panel, left) and magnetograms (lower panel, right), SOHO/EIT images (upper panel, middle), GOES and RHESSI flare data (red and blue symbols) observed within the interval around the time of SDD data. |
|
When you want to zoom in on one of the images, simply move the mouse pointer over that image. |
 |
| Year | Month | Day | Hour | Min | Sec | NOAA | Proj.U | Proj.WS | Corr.U | Corr.WS | B | L | LCM | Pos.angle | r | MU | MP |
|---|---|---|---|---|---|---|---|---|---|---|---|---|---|---|---|---|---|
| 2004 | 11 | 05 | 15 | 59 | 32 | 10696 | 381 | 2309 | 192 | 1165 | 7.85 | 27.01 | -9.45 | 64.75 | 0.1799 | -507.2 | -179.0 |
| Flare | Date | Start | Peak | End | Dur [s] | Peak [c/s] | Total Counts | Energy [keV] | X pos [asec] | Y pos [asec] | Radial [asec] | B [deg] | L [deg] | Flags |
|---|---|---|---|---|---|---|---|---|---|---|---|---|---|---|
| 4110517 | 5-Nov-2004 | 16:05:28 | 16:10:46 | 16:21:00 | 932 | 1507 | 4948669 | 6-12 | -155 | 95 | 182 | 9.57 | 25.75 | A0 DF DR ES P1 |
| 4110595 | 5-Nov-2004 | 16:21:00 | 16:29:42 | 16:31:00 | 600 | 1201 | 2219864 | 12-25 | -172 | 75 | 187 | 8.37 | 24.57 | A0 DF GE P1 PE |
| Date | Start | Peak | End | Classification | B [deg] | LCM [deg] |
|---|---|---|---|---|---|---|
| 5-Nov-2004 | 16:29 | 16:34 | 16:37 | C6.9 | 09 | -09 |

