
move the mouse pointer over that image.
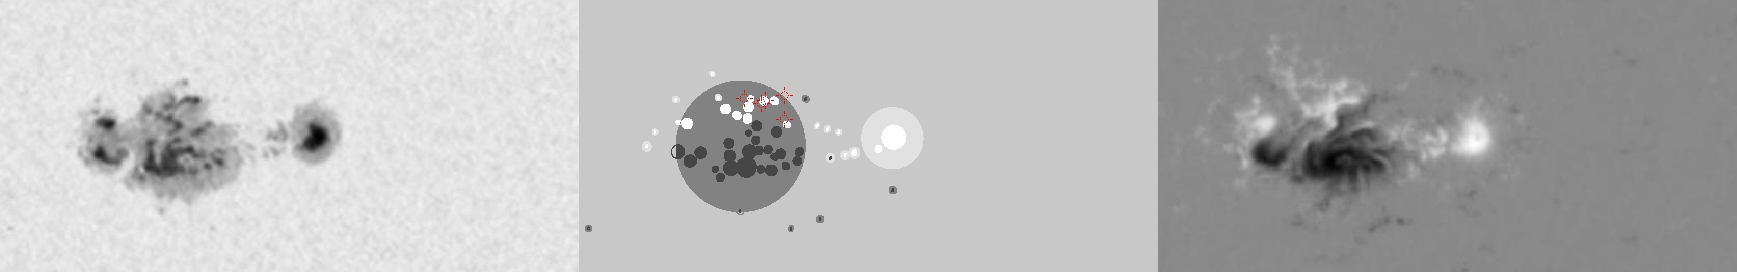
| Evolution of sunspot group NOAA 10696 and positions of flares in it animated by using the data of SOHO/MDI Debrecen Data (SDD) sunspot catalogue (lower panel, middle, ellipses with positions and areas corresponding to the relevant data of spots in SDD and with grey-scale colour coding of the magnetic polarities corresponding to that of the magnetograms), SOHO/MDI continuum images (lower panel, left) and magnetograms (lower panel, right), SOHO/EIT images (upper panel, middle), GOES and RHESSI flare data (red and blue symbols) observed within the interval around the time of SDD data. |
|
When you want to zoom in on one of the images, simply move the mouse pointer over that image. |
 |
| Year | Month | Day | Hour | Min | Sec | NOAA | Proj.U | Proj.WS | Corr.U | Corr.WS | B | L | LCM | Pos.angle | r | MU | MP |
|---|---|---|---|---|---|---|---|---|---|---|---|---|---|---|---|---|---|
| 2004 | 11 | 05 | 14 | 52 | 32 | 10696 | 413 | 2285 | 208 | 1153 | 7.78 | 27.06 | -10.01 | 66.52 | 0.1882 | -598.0 | -161.7 |
| Flare | Date | Start | Peak | End | Dur [s] | Peak [c/s] | Total Counts | Energy [keV] | X pos [asec] | Y pos [asec] | Radial [asec] | B [deg] | L [deg] | Flags |
|---|---|---|---|---|---|---|---|---|---|---|---|---|---|---|
| 4110515 | 5-Nov-2004 | 13:32:40 | 13:32:54 | 13:48:16 | 936 | 2416 | 3638784 | 12-25 | -172 | 94 | 196 | 9.51 | 26.15 | A0 DF GS P1 |
| 4110591 | 5-Nov-2004 | 13:48:16 | 13:49:46 | 13:54:08 | 352 | 352 | 547944 | 6-12 | -155 | 97 | 183 | 9.70 | 27.03 | A0 DF P1 |
| 4110516 | 5-Nov-2004 | 14:29:36 | 14:31:22 | 14:33:20 | 224 | 560 | 466416 | 6-12 | -143 | 82 | 165 | 8.81 | 27.41 | A0 DF P1 |
| 4110594 | 5-Nov-2004 | 15:12:32 | 15:12:58 | 15:16:24 | 232 | 48 | 60336 | 6-12 | -145 | 92 | 172 | 9.40 | 26.89 | A0 DF GS P1 |
| 4110562 | 5-Nov-2004 | 15:16:24 | 15:21:34 | 15:30:00 | 816 | 176 | 524856 | 6-12 | -153 | 95 | 180 | 9.58 | 26.32 | A0 DF P1 |
| Date | Start | Peak | End | Classification | B [deg] | LCM [deg] |
|---|---|---|---|---|---|---|
| No data |

