move the mouse pointer over that image.
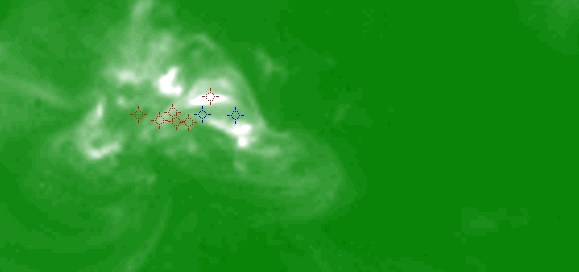
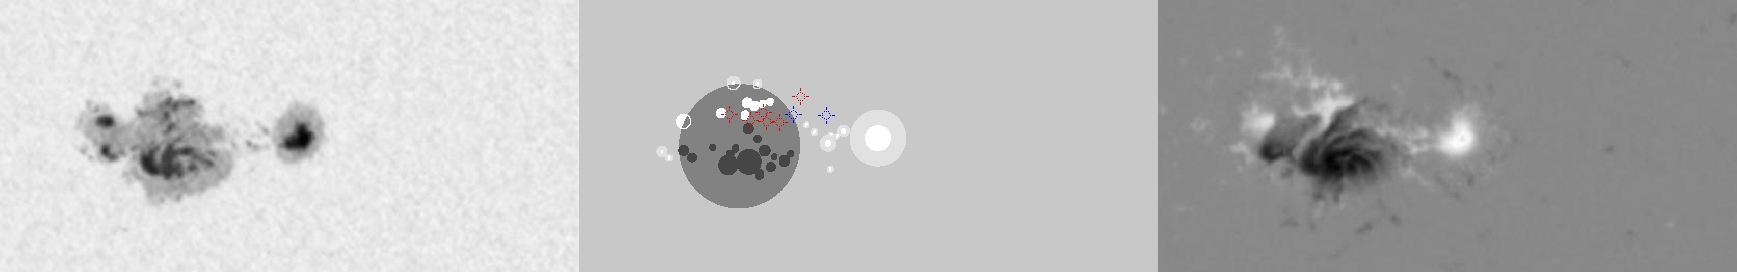
| Evolution of sunspot group NOAA 10696 and positions of flares in it animated by using the data of SOHO/MDI Debrecen Data (SDD) sunspot catalogue (lower panel, middle, ellipses with positions and areas corresponding to the relevant data of spots in SDD and with grey-scale colour coding of the magnetic polarities corresponding to that of the magnetograms), SOHO/MDI continuum images (lower panel, left) and magnetograms (lower panel, right), SOHO/EIT images (upper panel, middle), GOES and RHESSI flare data (red and blue symbols) observed within the interval around the time of SDD data. |
|
When you want to zoom in on one of the images, simply move the mouse pointer over that image. |
 |
| Year | Month | Day | Hour | Min | Sec | NOAA | Proj.U | Proj.WS | Corr.U | Corr.WS | B | L | LCM | Pos.angle | r | MU | MP |
|---|---|---|---|---|---|---|---|---|---|---|---|---|---|---|---|---|---|
| 2004 | 11 | 05 | 06 | 38 | 32 | 10696 | 339 | 1999 | 177 | 1027 | 7.86 | 26.95 | -14.64 | 73.61 | 0.2622 | -452.2 | -215.1 |
| Flare | Date | Start | Peak | End | Dur [s] | Peak [c/s] | Total Counts | Energy [keV] | X pos [asec] | Y pos [asec] | Radial [asec] | B [deg] | L [deg] | Flags |
|---|---|---|---|---|---|---|---|---|---|---|---|---|---|---|
| 4110582 | 5-Nov-2004 | 04:06:28 | 04:08:58 | 04:12:00 | 332 | 68 | 107328 | 6-12 | -243 | 97 | 262 | 9.67 | 26.92 | A0 DF DR P1 |
| 4110507 | 5-Nov-2004 | 05:11:44 | 05:11:50 | 05:12:24 | 40 | 5 | 950 | 12-25 | -248 | 87 | 263 | 9.06 | 26.06 | A0 DF DR GS P1 |
| 4110551 | 5-Nov-2004 | 05:12:48 | 05:14:54 | 05:18:40 | 352 | 42 | 41471 | 12-25 | -237 | 81 | 250 | 8.71 | 26.73 | a0 A1 DF DR P1 |
| 4110584 | 5-Nov-2004 | 05:18:40 | 05:21:42 | 05:25:48 | 428 | 56 | 46248 | 12-25 | -243 | 81 | 256 | 8.71 | 26.30 | A1 DF DR P1 |
| 4110532 | 5-Nov-2004 | 05:49:28 | 05:53:10 | 05:54:20 | 292 | 115 | 48803 | 12-25 | -244 | 82 | 258 | 8.76 | 25.94 | a0 A1 DF DR EE P1 |
| 4110585 | 5-Nov-2004 | 07:13:16 | 07:13:42 | 07:14:44 | 88 | 7 | 3168 | 6-12 | -234 | 85 | 249 | 8.95 | 25.82 | A0 DF P1 |
| Date | Start | Peak | End | Classification | B [deg] | LCM [deg] |
|---|---|---|---|---|---|---|
| 5-Nov-2004 | 05:12 | 05:22 | 05:25 | C2.3 | 09 | -13 |
| 5-Nov-2004 | 05:49 | 05:53 | 05:55 | C2.8 | 09 | -14 |

