move the mouse pointer over that image.
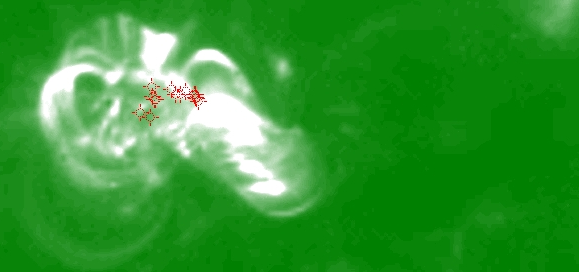
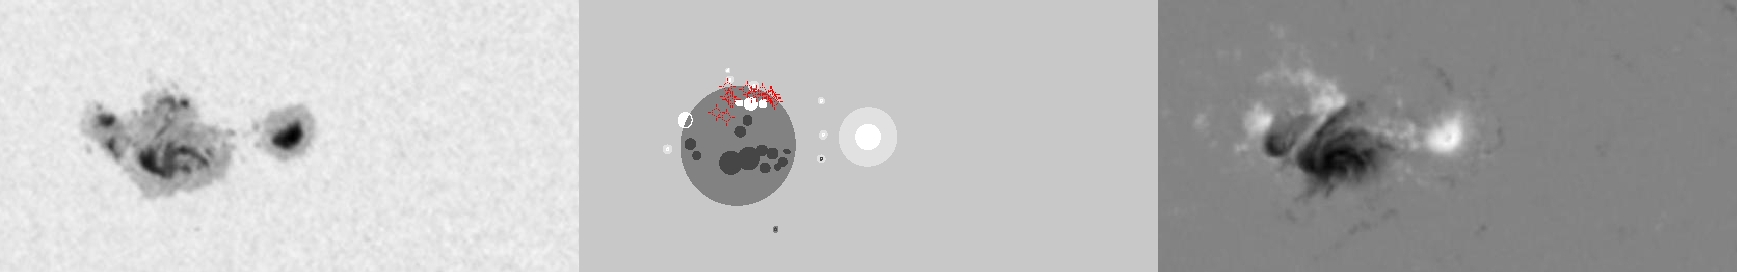
| Evolution of sunspot group NOAA 10696 and positions of flares in it animated by using the data of SOHO/MDI Debrecen Data (SDD) sunspot catalogue (lower panel, middle, ellipses with positions and areas corresponding to the relevant data of spots in SDD and with grey-scale colour coding of the magnetic polarities corresponding to that of the magnetograms), SOHO/MDI continuum images (lower panel, left) and magnetograms (lower panel, right), SOHO/EIT images (upper panel, middle), GOES and RHESSI flare data (red and blue symbols) observed within the interval around the time of SDD data. |
|
When you want to zoom in on one of the images, simply move the mouse pointer over that image. |
 |
| Year | Month | Day | Hour | Min | Sec | NOAA | Proj.U | Proj.WS | Corr.U | Corr.WS | B | L | LCM | Pos.angle | r | MU | MP |
|---|---|---|---|---|---|---|---|---|---|---|---|---|---|---|---|---|---|
| 2004 | 11 | 05 | 01 | 35 | 32 | 10696 | 312 | 1845 | 161 | 961 | 7.84 | 26.92 | -17.45 | 76.13 | 0.3073 | -418.0 | -234.6 |
| Flare | Date | Start | Peak | End | Dur [s] | Peak [c/s] | Total Counts | Energy [keV] | X pos [asec] | Y pos [asec] | Radial [asec] | B [deg] | L [deg] | Flags |
|---|---|---|---|---|---|---|---|---|---|---|---|---|---|---|
| 4110545 | 5-Nov-2004 | 00:47:44 | 00:49:10 | 00:49:40 | 116 | 13 | 8103 | 6-12 | -275 | 96 | 291 | 9.58 | 26.75 | A0 DF P1 |
| 4110575 | 5-Nov-2004 | 00:50:20 | 00:50:50 | 00:51:00 | 40 | 13 | 2868 | 6-12 | -275 | 98 | 292 | 9.70 | 26.72 | A0 DF P1 |
| 4110528 | 5-Nov-2004 | 00:55:36 | 00:57:06 | 00:58:36 | 180 | 12 | 11770 | 6-12 | -273 | 96 | 290 | 9.59 | 26.80 | A0 DF P1 |
| 4110577 | 5-Nov-2004 | 00:59:08 | 00:59:10 | 01:00:20 | 72 | 14 | 4754 | 12-25 | -271 | 94 | 287 | 9.47 | 26.91 | A0 DF DR P1 |
| 4110503 | 5-Nov-2004 | 01:41:32 | 01:42:14 | 01:52:08 | 636 | 656 | 1880184 | 12-25 | -261 | 98 | 279 | 9.72 | 27.13 | A0 DF DR ES P1 |
| 4110579 | 5-Nov-2004 | 01:52:08 | 01:53:38 | 02:07:20 | 912 | 496 | 2223360 | 12-25 | -263 | 100 | 282 | 9.83 | 26.90 | A0 DF DR P1 PE |
| 4110546 | 5-Nov-2004 | 02:07:20 | 02:08:50 | 02:18:08 | 648 | 384 | 1277952 | 12-25 | -265 | 98 | 282 | 9.71 | 26.64 | A0 DF DR P1 |
| 4110547 | 5-Nov-2004 | 02:18:08 | 02:18:58 | 02:26:28 | 500 | 320 | 818496 | 6-12 | -259 | 98 | 277 | 9.72 | 26.92 | A0 DF P1 |
| 4110548 | 5-Nov-2004 | 02:26:28 | 02:29:46 | 02:42:16 | 948 | 304 | 1251528 | 6-12 | -262 | 101 | 281 | 9.89 | 26.63 | A0 DF DR P1 |
| 4110531 | 5-Nov-2004 | 03:17:48 | 03:23:14 | 03:24:28 | 400 | 320 | 360336 | 12-25 | -266 | 86 | 279 | 8.99 | 25.93 | A0 DF P1 Q2 |
| 4110504 | 5-Nov-2004 | 03:29:52 | 03:31:58 | 03:40:20 | 628 | 880 | 982368 | 12-25 | -257 | 83 | 271 | 8.82 | 26.42 | A0 DF DR GS P1 PE |
| 4110580 | 5-Nov-2004 | 03:40:20 | 03:44:10 | 03:52:08 | 708 | 112 | 344832 | 6-12 | -250 | 94 | 267 | 9.48 | 26.72 | A0 DF DR P1 |
| 4110549 | 5-Nov-2004 | 03:52:08 | 03:53:38 | 04:00:56 | 528 | 76 | 181536 | 6-12 | -248 | 94 | 265 | 9.48 | 26.76 | A0 DF P1 |
| 4110581 | 5-Nov-2004 | 04:00:56 | 04:01:58 | 04:03:36 | 160 | 60 | 47280 | 6-12 | -247 | 96 | 265 | 9.60 | 26.74 | A0 DF P1 |
| 4110550 | 5-Nov-2004 | 04:03:36 | 04:04:14 | 04:06:28 | 172 | 56 | 51024 | 6-12 | -247 | 102 | 267 | 9.96 | 26.70 | A0 DF P1 |
| Date | Start | Peak | End | Classification | B [deg] | LCM [deg] |
|---|---|---|---|---|---|---|
| No data |

