move the mouse pointer over that image.
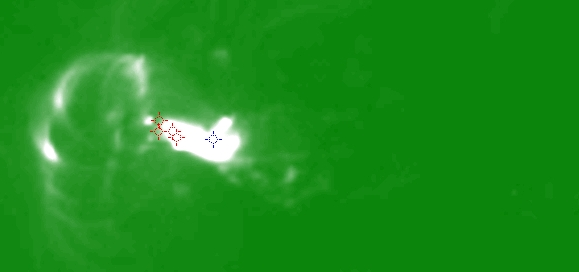
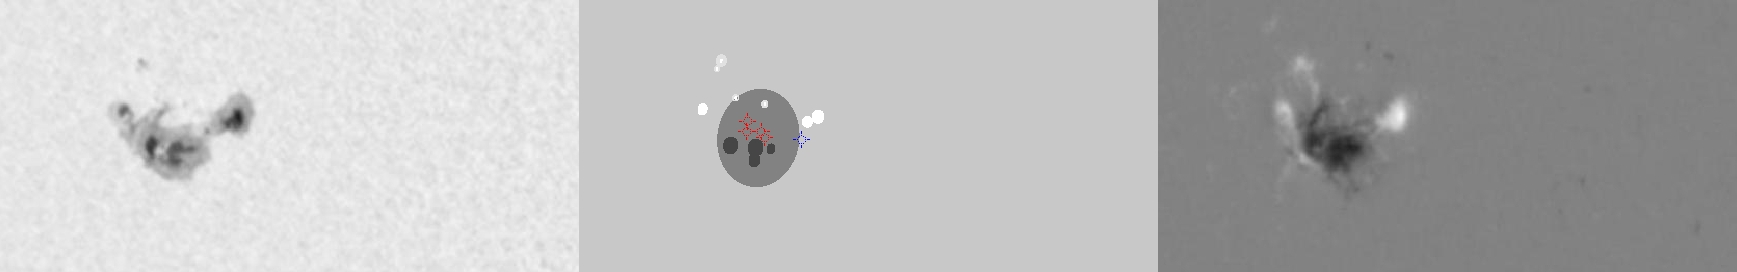
| Evolution of sunspot group NOAA 10696 and positions of flares in it animated by using the data of SOHO/MDI Debrecen Data (SDD) sunspot catalogue (lower panel, middle, ellipses with positions and areas corresponding to the relevant data of spots in SDD and with grey-scale colour coding of the magnetic polarities corresponding to that of the magnetograms), SOHO/MDI continuum images (lower panel, left) and magnetograms (lower panel, right), SOHO/EIT images (upper panel, middle), GOES and RHESSI flare data (red and blue symbols) observed within the interval around the time of SDD data. |
|
When you want to zoom in on one of the images, simply move the mouse pointer over that image. |
 |
| Year | Month | Day | Hour | Min | Sec | NOAA | Proj.U | Proj.WS | Corr.U | Corr.WS | B | L | LCM | Pos.angle | r | MU | MP |
|---|---|---|---|---|---|---|---|---|---|---|---|---|---|---|---|---|---|
| 2004 | 11 | 03 | 19 | 11 | 32 | 10696 | 112 | 862 | 66 | 518 | 7.99 | 26.53 | -34.54 | 81.71 | 0.5695 | -461.0 | -189.5 |
| Flare | Date | Start | Peak | End | Dur [s] | Peak [c/s] | Total Counts | Energy [keV] | X pos [asec] | Y pos [asec] | Radial [asec] | B [deg] | L [deg] | Flags |
|---|---|---|---|---|---|---|---|---|---|---|---|---|---|---|
| 4110370 | 3-Nov-2004 | 18:30:16 | 18:30:22 | 18:42:40 | 744 | 208 | 494474 | 25-50 | -530 | 76 | 536 | 8.00 | 26.45 | a0 A1 DF EE GS P1 |
| 4110332 | 3-Nov-2004 | 19:17:36 | 19:18:22 | 19:37:24 | 1188 | 848 | 3612108 | 12-25 | -529 | 86 | 536 | 8.59 | 26.03 | A0 a1 DF DR ES P1 |
| 41103101 | 3-Nov-2004 | 19:37:24 | 19:40:30 | 19:54:28 | 1024 | 688 | 2088192 | 6-12 | -524 | 79 | 530 | 8.19 | 26.23 | A0 DF DR P1 PE |
| 4110371 | 3-Nov-2004 | 19:54:28 | 19:55:26 | 20:08:16 | 828 | 288 | 1174848 | 12-25 | -511 | 79 | 517 | 8.22 | 27.02 | A0 DF P1 PE |
| Date | Start | Peak | End | Classification | B [deg] | LCM [deg] |
|---|---|---|---|---|---|---|
| 3-Nov-2004 | 18:03 | 18:26 | 18:35 | M1.0 | 08 | -33 |

