move the mouse pointer over that image.
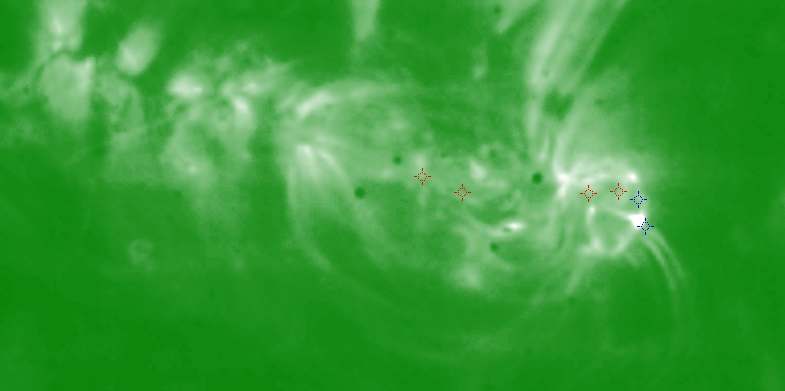
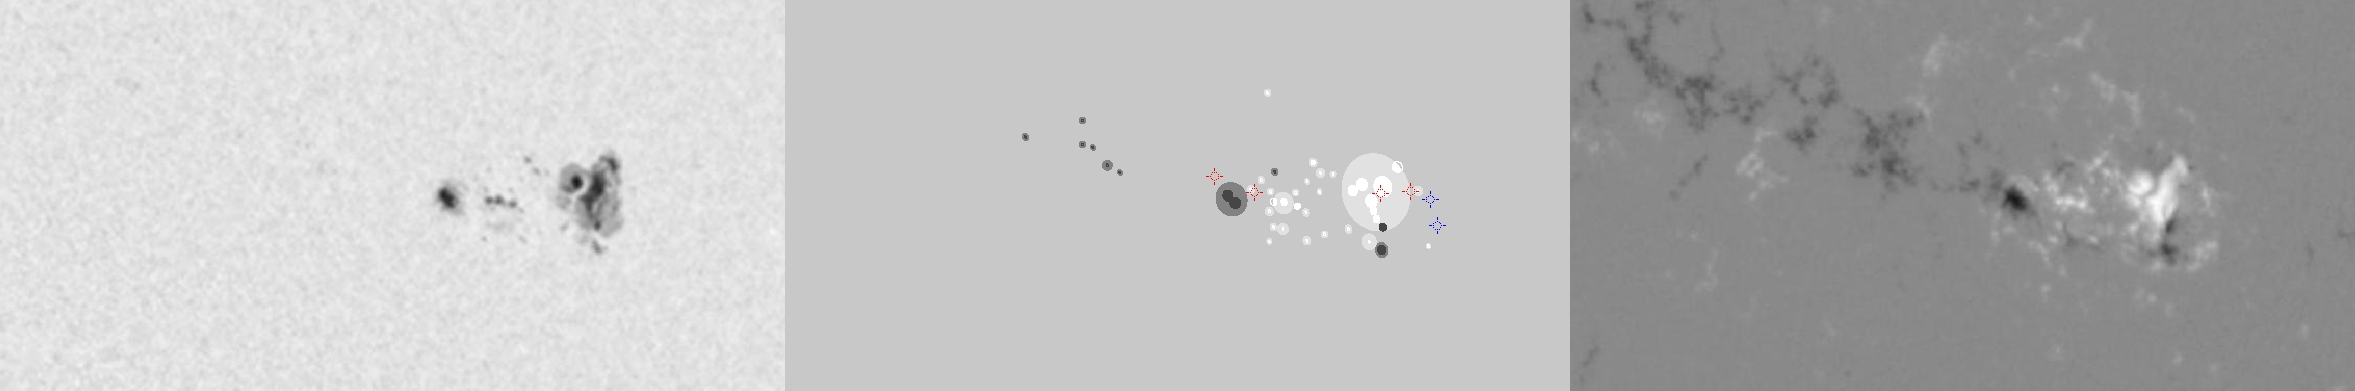
| Evolution of sunspot group NOAA 10691 and positions of flares in it animated by using the data of SOHO/MDI Debrecen Data (SDD) sunspot catalogue (lower panel, middle, ellipses with positions and areas corresponding to the relevant data of spots in SDD and with grey-scale colour coding of the magnetic polarities corresponding to that of the magnetograms), SOHO/MDI continuum images (lower panel, left) and magnetograms (lower panel, right), SOHO/EIT images (upper panel, middle), GOES and RHESSI flare data (red and blue symbols) observed within the interval around the time of SDD data. |
|
When you want to zoom in on one of the images, simply move the mouse pointer over that image. |
 |
| Year | Month | Day | Hour | Min | Sec | NOAA | Proj.U | Proj.WS | Corr.U | Corr.WS | B | L | LCM | Pos.angle | r | MU | MP |
|---|---|---|---|---|---|---|---|---|---|---|---|---|---|---|---|---|---|
| 2004 | 10 | 31 | 01 | 35 | 32 | 10691 | 155 | 892 | 90 | 516 | 13.34 | 140.45 | 30.16 | 288.91 | 0.5183 | 752.6 | 422.3 |
| Flare | Date | Start | Peak | End | Dur [s] | Peak [c/s] | Total Counts | Energy [keV] | X pos [asec] | Y pos [asec] | Radial [asec] | B [deg] | L [deg] | Flags |
|---|---|---|---|---|---|---|---|---|---|---|---|---|---|---|
| 4103101 | 31-Oct-2004 | 00:40:08 | 00:52:30 | 01:06:20 | 1572 | 34 | 88651 | 12-25 | 523 | 160 | 546 | 13.35 | 143.42 | a0 A1 DF DR P1 |
| 4103139 | 31-Oct-2004 | 01:41:44 | 01:42:30 | 01:46:52 | 308 | 3 | 1924 | 6-12 | 439 | 160 | 468 | 13.58 | 136.99 | A0 DF P1 |
| 4103175 | 31-Oct-2004 | 02:04:48 | 02:07:38 | 02:14:48 | 600 | 15 | 23803 | 12-25 | 421 | 170 | 455 | 14.23 | 135.60 | A0 DF DR P1 |
| 4103121 | 31-Oct-2004 | 02:14:48 | 02:23:54 | 02:42:48 | 1680 | 1840 | 2700663 | 25-50 | 527 | 160 | 551 | 13.33 | 142.88 | a0 A1 DF DR EE P1 |
| Date | Start | Peak | End | Classification | B [deg] | LCM [deg] |
|---|---|---|---|---|---|---|
| 31-Oct-2004 | 00:42 | 00:55 | 01:01 | C1.7 | 13 | 34 |
| 31-Oct-2004 | 02:04 | 02:26 | 02:32 | M1.1 | 12 | 35 |

