move the mouse pointer over that image.
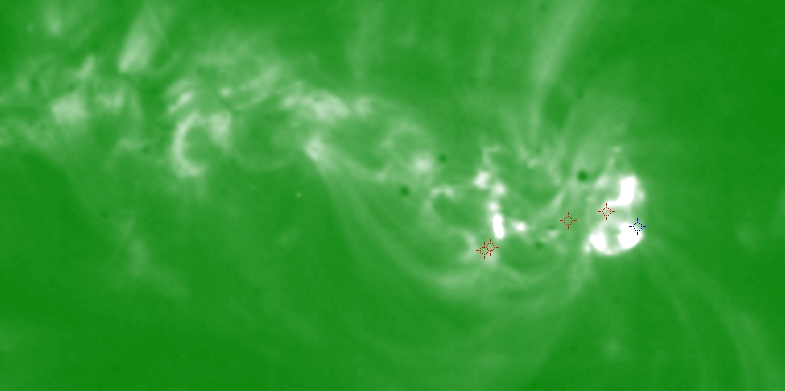
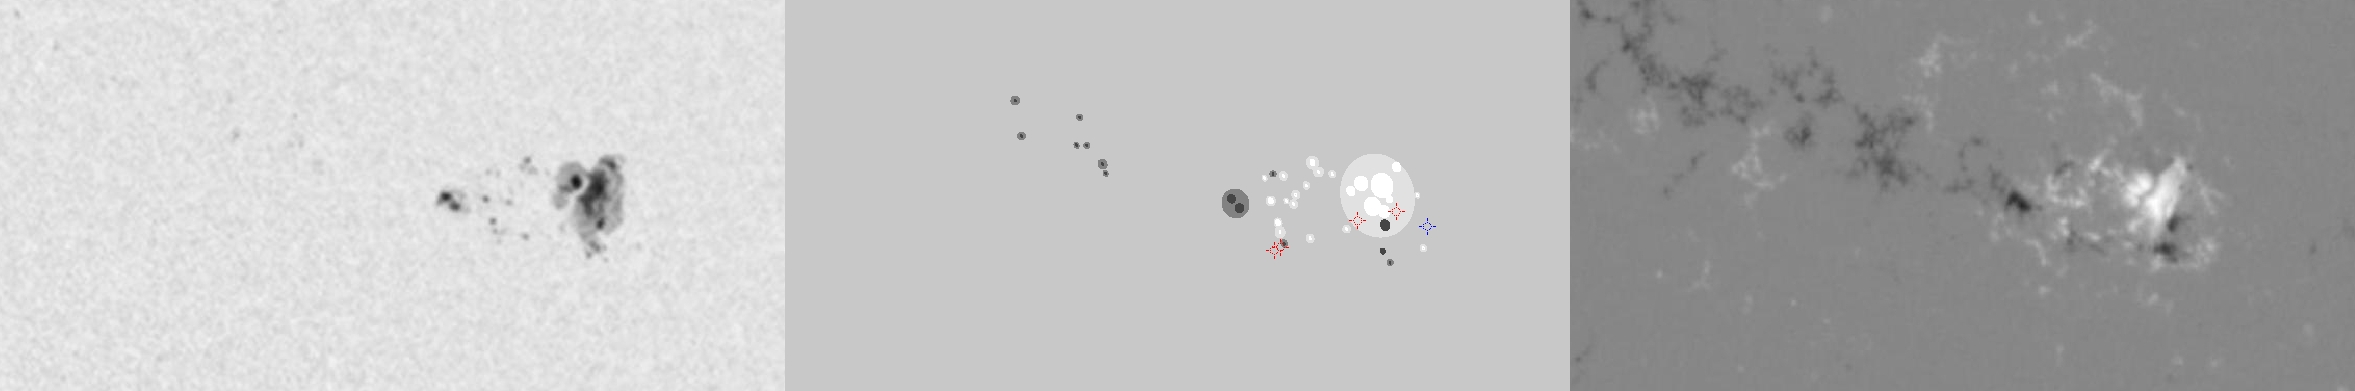
| Evolution of sunspot group NOAA 10691 and positions of flares in it animated by using the data of SOHO/MDI Debrecen Data (SDD) sunspot catalogue (lower panel, middle, ellipses with positions and areas corresponding to the relevant data of spots in SDD and with grey-scale colour coding of the magnetic polarities corresponding to that of the magnetograms), SOHO/MDI continuum images (lower panel, left) and magnetograms (lower panel, right), SOHO/EIT images (upper panel, middle), GOES and RHESSI flare data (red and blue symbols) observed within the interval around the time of SDD data. |
|
When you want to zoom in on one of the images, simply move the mouse pointer over that image. |
 |
| Year | Month | Day | Hour | Min | Sec | NOAA | Proj.U | Proj.WS | Corr.U | Corr.WS | B | L | LCM | Pos.angle | r | MU | MP |
|---|---|---|---|---|---|---|---|---|---|---|---|---|---|---|---|---|---|
| 2004 | 10 | 30 | 22 | 23 | 32 | 10691 | 179 | 891 | 104 | 510 | 13.36 | 140.69 | 28.65 | 289.73 | 0.4969 | 977.0 | 377.7 |
| Flare | Date | Start | Peak | End | Dur [s] | Peak [c/s] | Total Counts | Energy [keV] | X pos [asec] | Y pos [asec] | Radial [asec] | B [deg] | L [deg] | Flags |
|---|---|---|---|---|---|---|---|---|---|---|---|---|---|---|
| 4103032 | 30-Oct-2004 | 21:46:24 | 21:53:54 | 21:54:48 | 504 | 4134 | 2378493 | 12-25 | 492 | 146 | 513 | 12.61 | 142.69 | A0 DF EE P1 |
| 4103034 | 30-Oct-2004 | 22:29:16 | 22:29:58 | 22:33:40 | 264 | 336 | 368304 | 6-12 | 426 | 122 | 443 | 11.35 | 137.60 | A0 DF ES P1 |
| 41030117 | 30-Oct-2004 | 22:33:40 | 22:35:06 | 22:39:52 | 372 | 256 | 417216 | 6-12 | 431 | 124 | 448 | 11.46 | 137.91 | A0 DF P1 |
| 41030118 | 30-Oct-2004 | 22:39:52 | 22:44:02 | 23:00:16 | 1224 | 336 | 780432 | 12-25 | 481 | 141 | 501 | 12.34 | 141.41 | A0 DF DR P1 PE |
| Date | Start | Peak | End | Classification | B [deg] | LCM [deg] |
|---|---|---|---|---|---|---|
| 30-Oct-2004 | 21:51 | 21:59 | 22:04 | C2.4 | 12 | 32 |

