move the mouse pointer over that image.
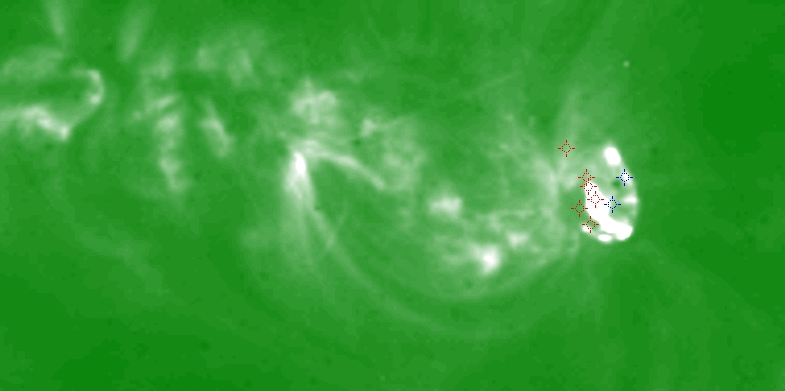
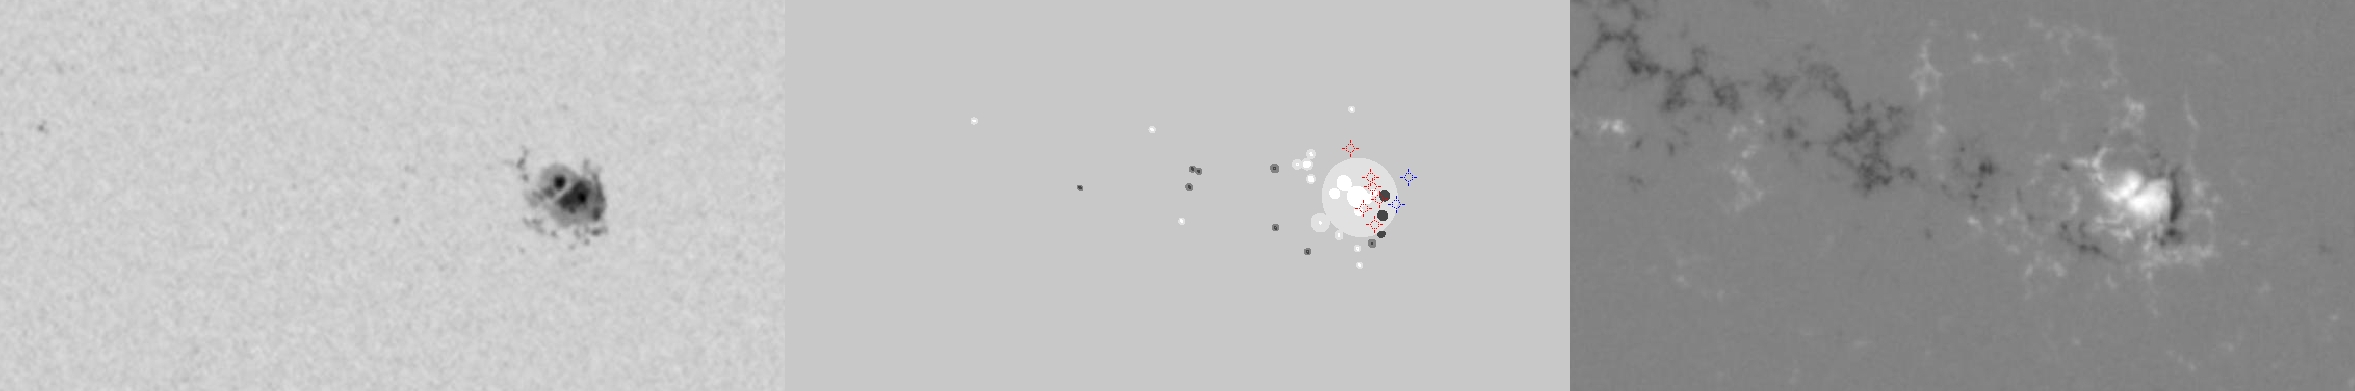
| Evolution of sunspot group NOAA 10691 and positions of flares in it animated by using the data of SOHO/MDI Debrecen Data (SDD) sunspot catalogue (lower panel, middle, ellipses with positions and areas corresponding to the relevant data of spots in SDD and with grey-scale colour coding of the magnetic polarities corresponding to that of the magnetograms), SOHO/MDI continuum images (lower panel, left) and magnetograms (lower panel, right), SOHO/EIT images (upper panel, middle), GOES and RHESSI flare data (red and blue symbols) observed within the interval around the time of SDD data. |
|
When you want to zoom in on one of the images, simply move the mouse pointer over that image. |
 |
| Year | Month | Day | Hour | Min | Sec | NOAA | Proj.U | Proj.WS | Corr.U | Corr.WS | B | L | LCM | Pos.angle | r | MU | MP |
|---|---|---|---|---|---|---|---|---|---|---|---|---|---|---|---|---|---|
| 2004 | 10 | 30 | 06 | 07 | 32 | 10691 | 133 | 767 | 71 | 408 | 13.33 | 140.80 | 19.82 | 295.89 | 0.3682 | 1206.3 | 522.7 |
| Flare | Date | Start | Peak | End | Dur [s] | Peak [c/s] | Total Counts | Energy [keV] | X pos [asec] | Y pos [asec] | Radial [asec] | B [deg] | L [deg] | Flags |
|---|---|---|---|---|---|---|---|---|---|---|---|---|---|---|
| 4103077 | 30-Oct-2004 | 05:08:48 | 05:13:34 | 05:16:24 | 456 | 120 | 145800 | 6-12 | 340 | 133 | 365 | 12.25 | 141.45 | A0 DR P1 |
| 41030104 | 30-Oct-2004 | 05:16:24 | 05:18:22 | 05:25:12 | 528 | 60 | 101952 | 6-12 | 344 | 149 | 375 | 13.21 | 141.75 | A0 DR P1 PE |
| 4103040 | 30-Oct-2004 | 05:25:12 | 05:30:14 | 05:36:16 | 664 | 232 | 410736 | 12-25 | 342 | 163 | 379 | 14.05 | 141.59 | A0 DR P1 PE |
| 41030105 | 30-Oct-2004 | 05:36:16 | 05:37:38 | 05:41:08 | 292 | 96 | 72864 | 6-12 | 345 | 157 | 379 | 13.68 | 141.69 | A0 DR P1 |
| 4103080 | 30-Oct-2004 | 06:29:08 | 06:29:42 | 06:35:44 | 396 | 6 | 4446 | 6-12 | 354 | 144 | 382 | 12.88 | 141.73 | A0 ES P1 |
| 4103054 | 30-Oct-2004 | 06:55:20 | 07:00:34 | 07:13:00 | 1060 | 688 | 529672 | 50-100 | 354 | 182 | 398 | 15.17 | 141.68 | a0 A1 DR GS P1 PE |
| Date | Start | Peak | End | Classification | B [deg] | LCM [deg] |
|---|---|---|---|---|---|---|
| 30-Oct-2004 | 06:08 | 06:18 | 06:22 | M4.2 | 13 | 22 |
| 30-Oct-2004 | 06:55 | 07:01 | 07:05 | C5.5 | 14 | 23 |

