move the mouse pointer over that image.
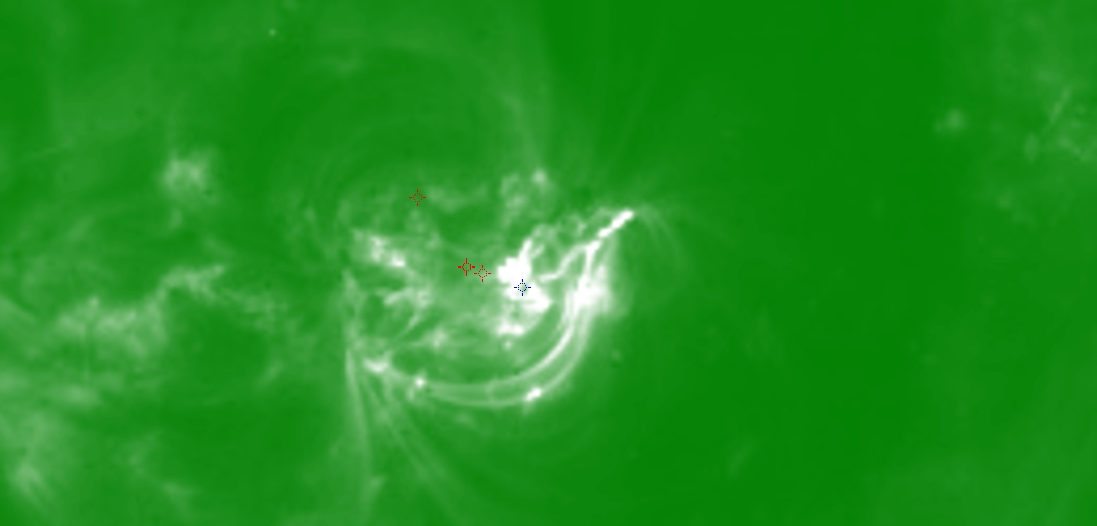
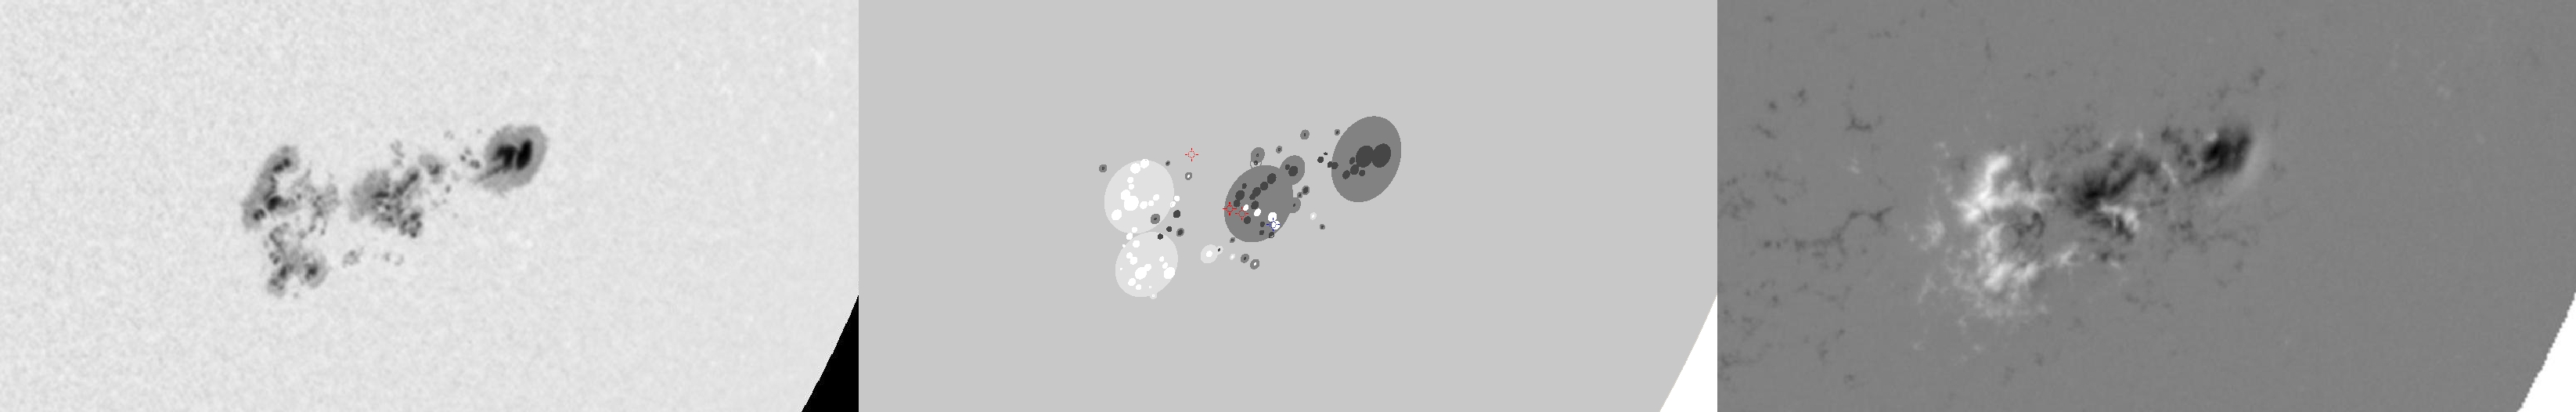
| Evolution of sunspot group NOAA 10656 and positions of flares in it animated by using the data of SOHO/MDI Debrecen Data (SDD) sunspot catalogue (lower panel, middle, ellipses with positions and areas corresponding to the relevant data of spots in SDD and with grey-scale colour coding of the magnetic polarities corresponding to that of the magnetograms), SOHO/MDI continuum images (lower panel, left) and magnetograms (lower panel, right), SOHO/EIT images (upper panel, middle), GOES and RHESSI flare data (red and blue symbols) observed within the interval around the time of SDD data. |
|
When you want to zoom in on one of the images, simply move the mouse pointer over that image. |
 |
| Year | Month | Day | Hour | Min | Sec | NOAA | Proj.U | Proj.WS | Corr.U | Corr.WS | B | L | LCM | Pos.angle | r | MU | MP |
|---|---|---|---|---|---|---|---|---|---|---|---|---|---|---|---|---|---|
| 2004 | 08 | 14 | 12 | 47 | 32 | 10656 | 579 | 3838 | 366 | 2418 | -12.52 | 86.00 | 32.75 | 239.10 | 0.6154 | -116.4 | -96.4 |
| Flare | Date | Start | Peak | End | Dur [s] | Peak [c/s] | Total Counts | Energy [keV] | X pos [asec] | Y pos [asec] | Radial [asec] | B [deg] | L [deg] | Flags |
|---|---|---|---|---|---|---|---|---|---|---|---|---|---|---|
| 4081461 | 14-Aug-2004 | 12:00:40 | 12:06:02 | 12:07:24 | 404 | 195 | 170495 | 6-12 | 501 | -311 | 589 | -13.32 | 85.30 | a0 A1 DF DR EE P1 |
| 4081484 | 14-Aug-2004 | 12:42:12 | 12:44:54 | 12:51:04 | 532 | 374 | 848809 | 12-25 | 471 | -263 | 540 | -10.16 | 82.41 | A0 a1 DF P1 |
| 40814122 | 14-Aug-2004 | 12:51:04 | 12:52:26 | 13:01:36 | 632 | 233 | 488185 | 6-12 | 503 | -306 | 589 | -13.01 | 84.97 | A0 DF DR P1 |
| 4081486 | 14-Aug-2004 | 13:05:24 | 13:09:26 | 13:17:24 | 720 | 234 | 523242 | 12-25 | 507 | -306 | 592 | -13.03 | 85.11 | A0 DF DR P1 |
| Date | Start | Peak | End | Classification | B [deg] | LCM [deg] |
|---|---|---|---|---|---|---|
| 14-Aug-2004 | 12:01 | 12:11 | 12:35 | C7.4 | -14 | 34 |

