move the mouse pointer over that image.
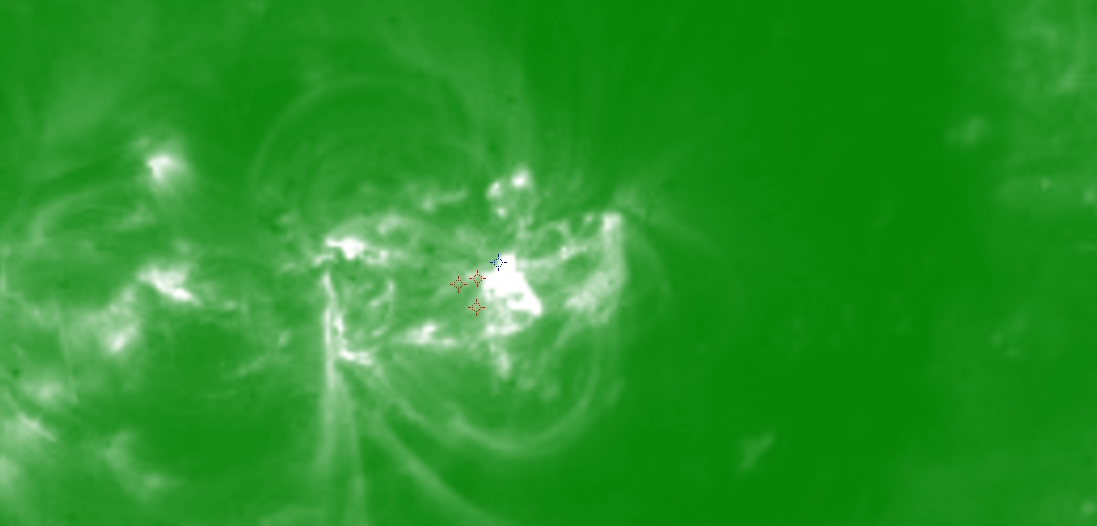
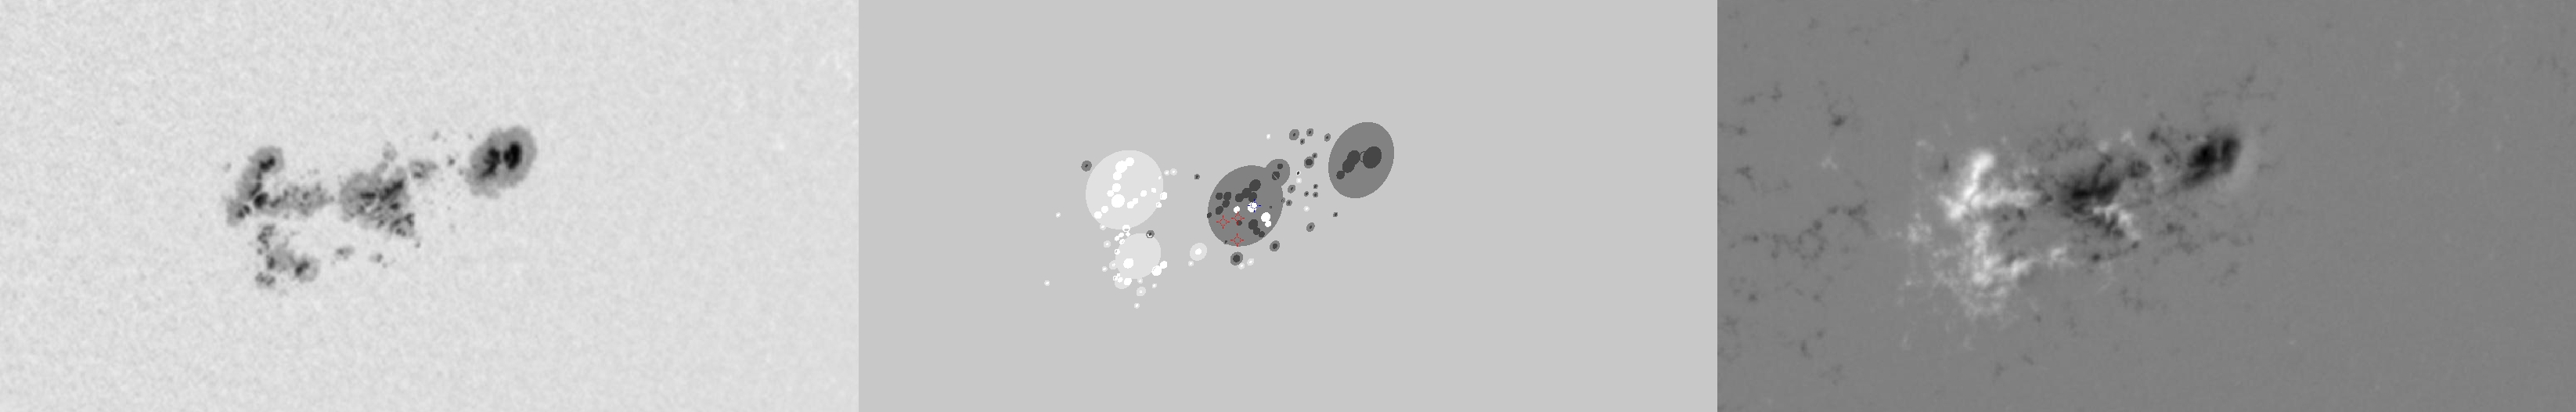
| Evolution of sunspot group NOAA 10656 and positions of flares in it animated by using the data of SOHO/MDI Debrecen Data (SDD) sunspot catalogue (lower panel, middle, ellipses with positions and areas corresponding to the relevant data of spots in SDD and with grey-scale colour coding of the magnetic polarities corresponding to that of the magnetograms), SOHO/MDI continuum images (lower panel, left) and magnetograms (lower panel, right), SOHO/EIT images (upper panel, middle), GOES and RHESSI flare data (red and blue symbols) observed within the interval around the time of SDD data. |
|
When you want to zoom in on one of the images, simply move the mouse pointer over that image. |
 |
| Year | Month | Day | Hour | Min | Sec | NOAA | Proj.U | Proj.WS | Corr.U | Corr.WS | B | L | LCM | Pos.angle | r | MU | MP |
|---|---|---|---|---|---|---|---|---|---|---|---|---|---|---|---|---|---|
| 2004 | 08 | 14 | 04 | 47 | 32 | 10656 | 553 | 3734 | 330 | 2235 | -12.35 | 85.76 | 28.10 | 235.32 | 0.5591 | -200.7 | -137.1 |
| Flare | Date | Start | Peak | End | Dur [s] | Peak [c/s] | Total Counts | Energy [keV] | X pos [asec] | Y pos [asec] | Radial [asec] | B [deg] | L [deg] | Flags |
|---|---|---|---|---|---|---|---|---|---|---|---|---|---|---|
| 4081413 | 14-Aug-2004 | 03:57:28 | 04:05:46 | 04:07:16 | 588 | 624 | 1123008 | 12-25 | 445 | -319 | 548 | -13.60 | 85.77 | A0 DF EE P1 |
| 4081415 | 14-Aug-2004 | 04:42:28 | 04:42:58 | 04:45:20 | 172 | 52 | 45356 | 6-12 | 454 | -336 | 565 | -14.73 | 86.21 | a0 A1 DF P1 |
| 40814117 | 14-Aug-2004 | 05:23:48 | 05:25:34 | 05:28:48 | 300 | 5 | 6245 | 6-12 | 454 | -321 | 556 | -13.76 | 85.68 | A0 DF P1 |
| Date | Start | Peak | End | Classification | B [deg] | LCM [deg] |
|---|---|---|---|---|---|---|
| 14-Aug-2004 | 04:10 | 04:14 | 04:17 | M2.4 | -13 | 29 |

