move the mouse pointer over that image.
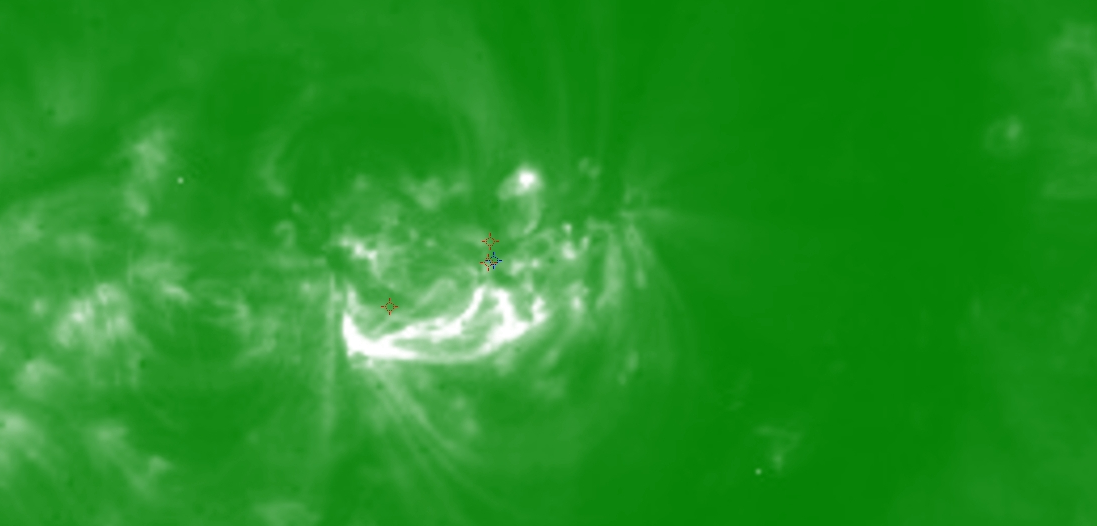
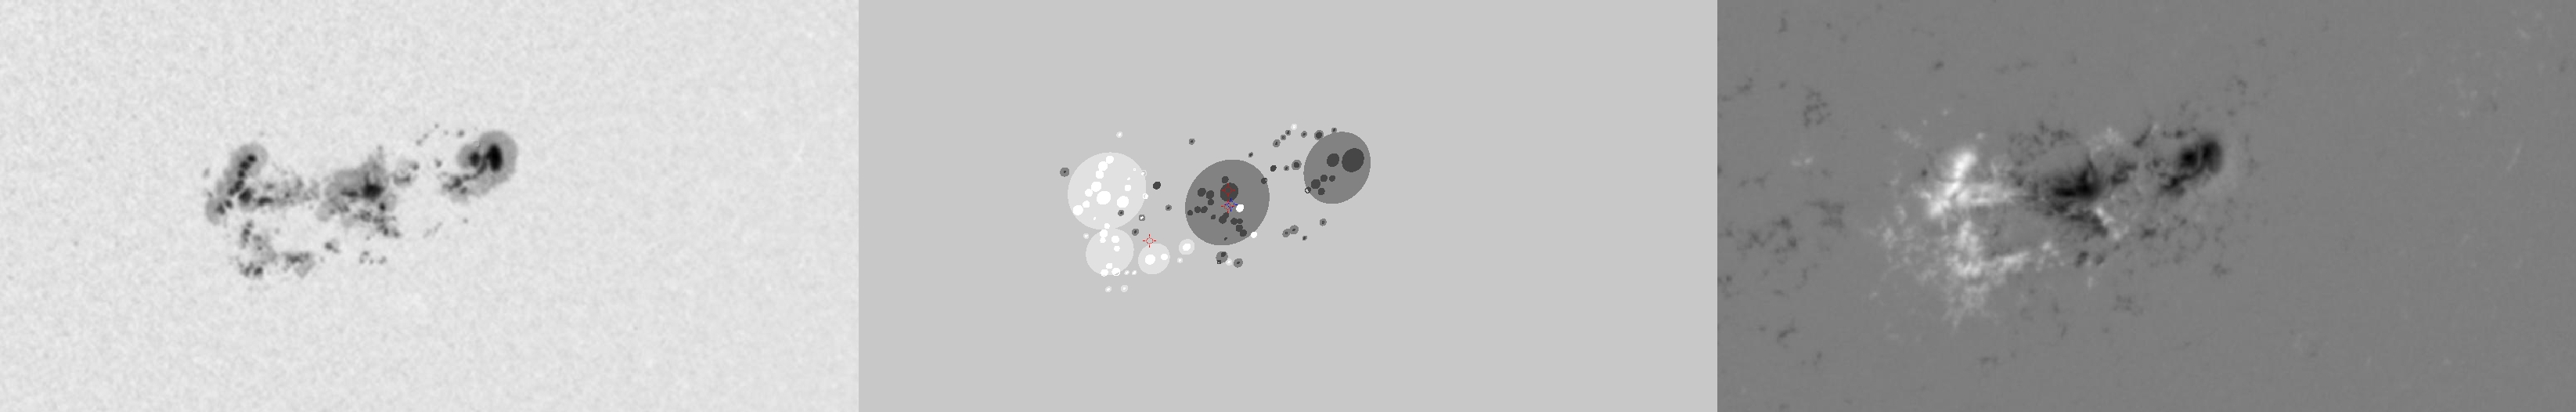
| Evolution of sunspot group NOAA 10656 and positions of flares in it animated by using the data of SOHO/MDI Debrecen Data (SDD) sunspot catalogue (lower panel, middle, ellipses with positions and areas corresponding to the relevant data of spots in SDD and with grey-scale colour coding of the magnetic polarities corresponding to that of the magnetograms), SOHO/MDI continuum images (lower panel, left) and magnetograms (lower panel, right), SOHO/EIT images (upper panel, middle), GOES and RHESSI flare data (red and blue symbols) observed within the interval around the time of SDD data. |
|
When you want to zoom in on one of the images, simply move the mouse pointer over that image. |
 |
| Year | Month | Day | Hour | Min | Sec | NOAA | Proj.U | Proj.WS | Corr.U | Corr.WS | B | L | LCM | Pos.angle | r | MU | MP |
|---|---|---|---|---|---|---|---|---|---|---|---|---|---|---|---|---|---|
| 2004 | 08 | 13 | 17 | 35 | 32 | 10656 | 554 | 3867 | 315 | 2192 | -12.57 | 85.27 | 21.44 | 227.42 | 0.4840 | -288.2 | -109.8 |
| Flare | Date | Start | Peak | End | Dur [s] | Peak [c/s] | Total Counts | Energy [keV] | X pos [asec] | Y pos [asec] | Radial [asec] | B [deg] | L [deg] | Flags |
|---|---|---|---|---|---|---|---|---|---|---|---|---|---|---|
| 4081332 | 13-Aug-2004 | 16:41:32 | 16:52:50 | 16:55:00 | 808 | 352 | 847008 | 12-25 | 357 | -315 | 476 | -13.06 | 85.92 | A0 DF P1 |
| 40813131 | 13-Aug-2004 | 17:53:12 | 17:56:50 | 18:04:24 | 672 | 88 | 190800 | 12-25 | 313 | -342 | 464 | -14.66 | 82.59 | A1 DR P1 PE |
| 40813105 | 13-Aug-2004 | 18:05:24 | 18:11:46 | 18:16:20 | 656 | 23140 | 25466560 | 100-300 | 214 | 421 | 472 | 32.25 | 78.06 | a0 a1 A3 DF DR P1 |
| 40813132 | 13-Aug-2004 | 18:16:20 | 18:17:30 | 18:23:28 | 428 | 9001 | 7099855 | 25-50 | 381 | -301 | 486 | -12.25 | 86.65 | a0 a1 A3 DF P1 Q3 SD |
| Date | Start | Peak | End | Classification | B [deg] | LCM [deg] |
|---|---|---|---|---|---|---|
| 13-Aug-2004 | 18:07 | 18:12 | 18:15 | X1.0 | -13 | 23 |

