move the mouse pointer over that image.
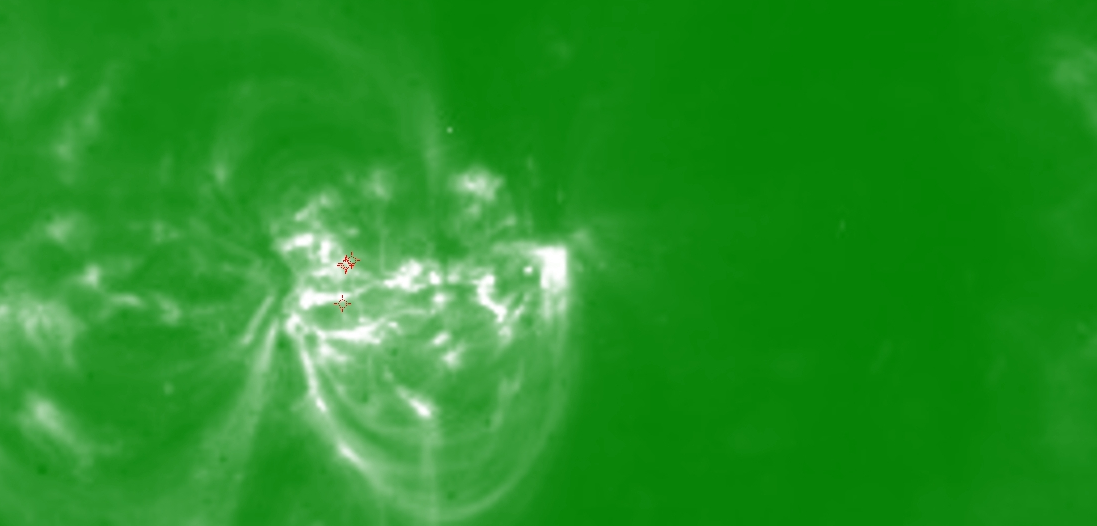
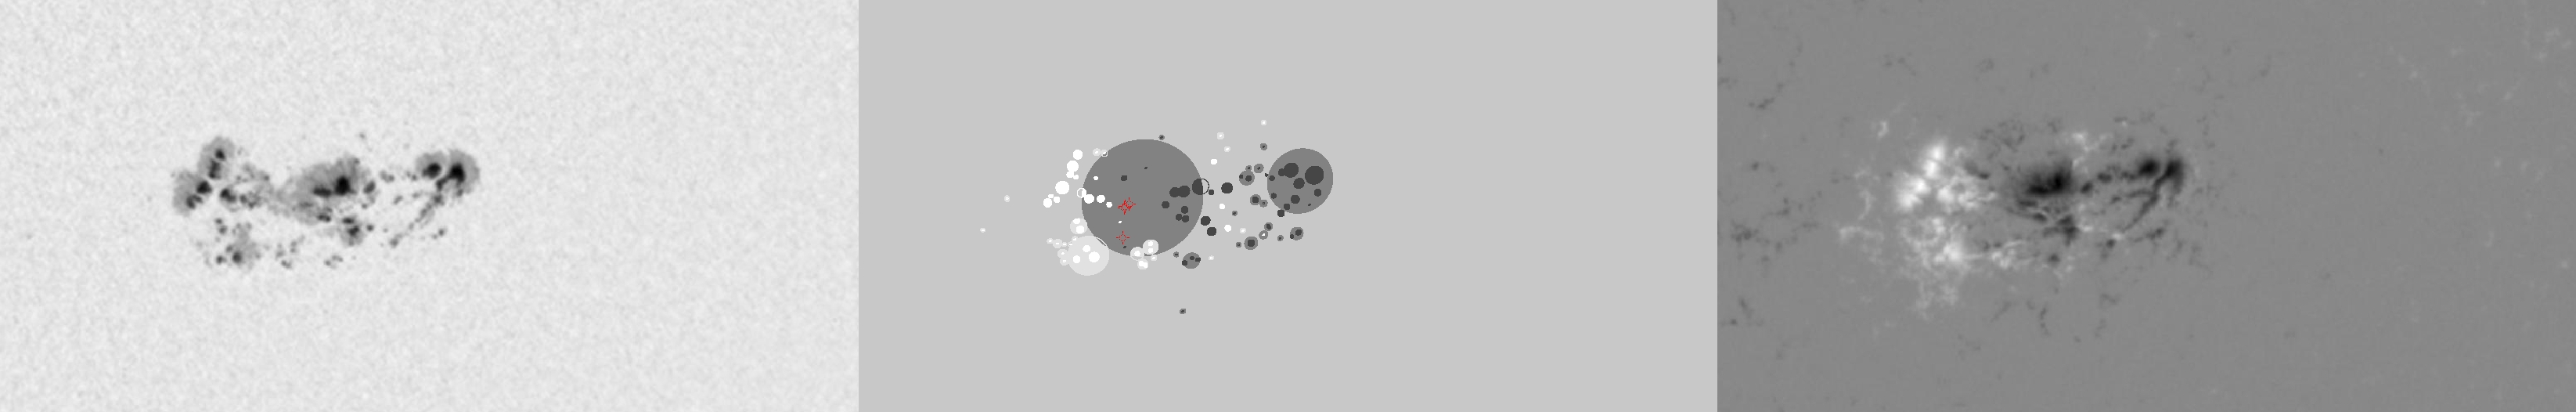
| Evolution of sunspot group NOAA 10656 and positions of flares in it animated by using the data of SOHO/MDI Debrecen Data (SDD) sunspot catalogue (lower panel, middle, ellipses with positions and areas corresponding to the relevant data of spots in SDD and with grey-scale colour coding of the magnetic polarities corresponding to that of the magnetograms), SOHO/MDI continuum images (lower panel, left) and magnetograms (lower panel, right), SOHO/EIT images (upper panel, middle), GOES and RHESSI flare data (red and blue symbols) observed within the interval around the time of SDD data. |
|
When you want to zoom in on one of the images, simply move the mouse pointer over that image. |
 |
| Year | Month | Day | Hour | Min | Sec | NOAA | Proj.U | Proj.WS | Corr.U | Corr.WS | B | L | LCM | Pos.angle | r | MU | MP |
|---|---|---|---|---|---|---|---|---|---|---|---|---|---|---|---|---|---|
| 2004 | 08 | 12 | 20 | 47 | 32 | 10656 | 581 | 3970 | 308 | 2122 | -12.70 | 85.03 | 9.75 | 206.02 | 0.3740 | -425.6 | -110.3 |
| Flare | Date | Start | Peak | End | Dur [s] | Peak [c/s] | Total Counts | Energy [keV] | X pos [asec] | Y pos [asec] | Radial [asec] | B [deg] | L [deg] | Flags |
|---|---|---|---|---|---|---|---|---|---|---|---|---|---|---|
| 4081234 | 12-Aug-2004 | 20:41:28 | 20:42:18 | 20:54:36 | 788 | 2032 | 3554088 | 6-12 | 126 | -347 | 370 | -14.69 | 82.43 | A0 DF ES P1 |
| 40812128 | 12-Aug-2004 | 20:54:36 | 21:04:10 | 21:11:36 | 1020 | 2672 | 6144576 | 12-25 | 138 | -320 | 349 | -12.98 | 82.91 | A0 DF DR P1 |
| 40812101 | 12-Aug-2004 | 21:11:36 | 21:24:46 | 21:27:28 | 952 | 848 | 2625408 | 12-25 | 140 | -323 | 352 | -13.17 | 82.85 | A0 DF DR P1 |
| 40812102 | 12-Aug-2004 | 21:27:28 | 21:28:38 | 21:35:28 | 480 | 560 | 748224 | 12-25 | 142 | -322 | 352 | -13.11 | 82.94 | A0 DF P1 PE |
| Date | Start | Peak | End | Classification | B [deg] | LCM [deg] |
|---|---|---|---|---|---|---|
| No data |

