move the mouse pointer over that image.
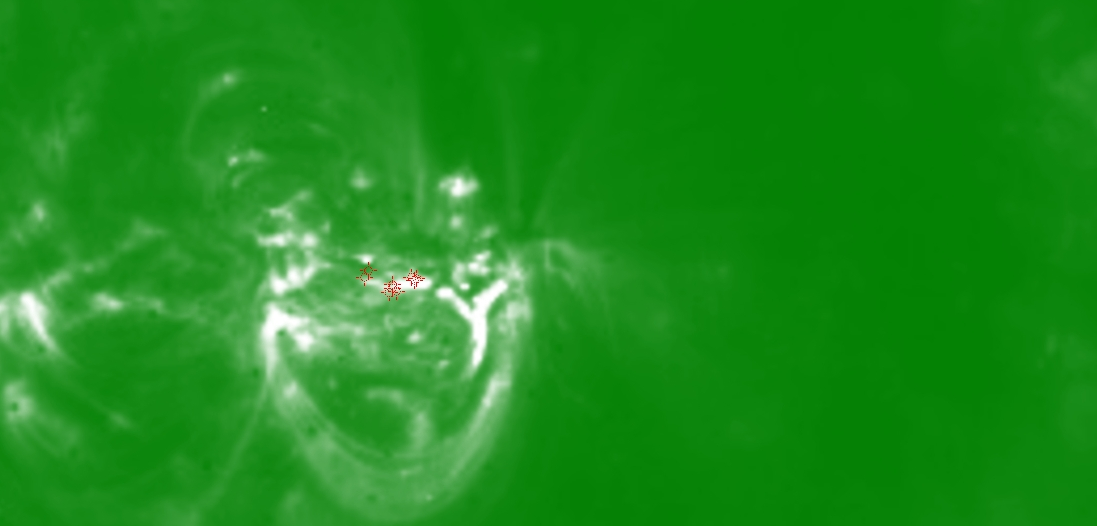
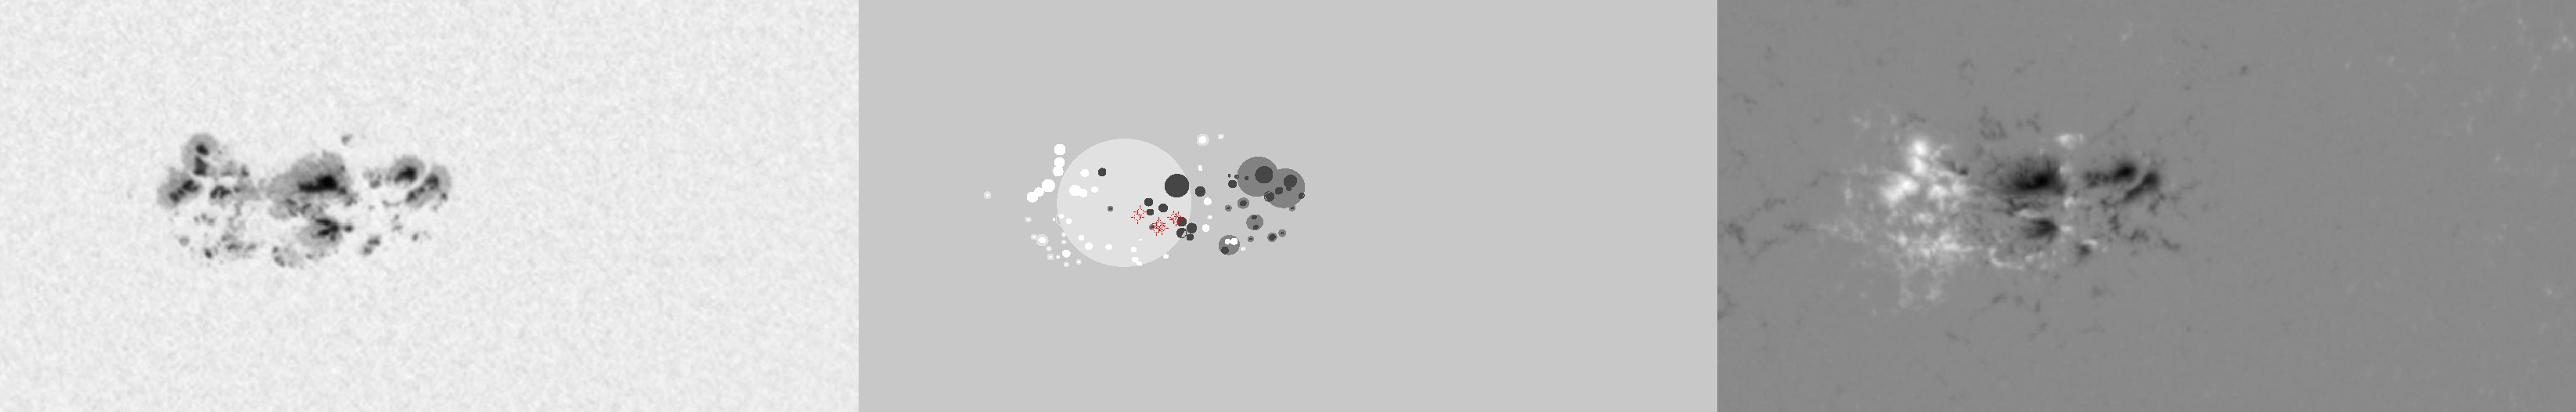
| Evolution of sunspot group NOAA 10656 and positions of flares in it animated by using the data of SOHO/MDI Debrecen Data (SDD) sunspot catalogue (lower panel, middle, ellipses with positions and areas corresponding to the relevant data of spots in SDD and with grey-scale colour coding of the magnetic polarities corresponding to that of the magnetograms), SOHO/MDI continuum images (lower panel, left) and magnetograms (lower panel, right), SOHO/EIT images (upper panel, middle), GOES and RHESSI flare data (red and blue symbols) observed within the interval around the time of SDD data. |
|
When you want to zoom in on one of the images, simply move the mouse pointer over that image. |
 |
| Year | Month | Day | Hour | Min | Sec | NOAA | Proj.U | Proj.WS | Corr.U | Corr.WS | B | L | LCM | Pos.angle | r | MU | MP |
|---|---|---|---|---|---|---|---|---|---|---|---|---|---|---|---|---|---|
| 2004 | 08 | 12 | 07 | 59 | 32 | 10656 | 599 | 3822 | 315 | 2013 | -12.73 | 84.57 | 2.24 | 186.30 | 0.3388 | -372.1 | -104.4 |
| Flare | Date | Start | Peak | End | Dur [s] | Peak [c/s] | Total Counts | Energy [keV] | X pos [asec] | Y pos [asec] | Radial [asec] | B [deg] | L [deg] | Flags |
|---|---|---|---|---|---|---|---|---|---|---|---|---|---|---|
| 40812112 | 12-Aug-2004 | 07:09:32 | 07:12:06 | 07:14:40 | 308 | 8 | 10186 | 6-12 | 42 | -342 | 344 | -14.34 | 84.68 | A0 DF P1 |
| 4081279 | 12-Aug-2004 | 07:14:40 | 07:16:02 | 07:17:52 | 192 | 6 | 6173 | 6-12 | 39 | -343 | 345 | -14.40 | 84.46 | A0 DF P1 |
| 40812113 | 12-Aug-2004 | 08:02:56 | 08:04:02 | 08:07:28 | 272 | 20 | 24720 | 6-12 | 55 | -340 | 344 | -14.22 | 85.00 | A0 DF P1 |
| 4081282 | 12-Aug-2004 | 08:09:12 | 08:10:02 | 08:11:00 | 108 | 20 | 10488 | 6-12 | 57 | -338 | 342 | -14.09 | 85.06 | A0 DF P1 |
| 4081283 | 12-Aug-2004 | 08:11:32 | 08:14:18 | 08:16:28 | 296 | 64 | 67560 | 6-12 | 72 | -335 | 342 | -13.91 | 85.94 | A0 DF P1 |
| 4081258 | 12-Aug-2004 | 08:16:28 | 08:20:14 | 08:23:52 | 444 | 192 | 203088 | 6-12 | 72 | -333 | 340 | -13.78 | 85.88 | A0 DF P1 |
| 40812114 | 12-Aug-2004 | 08:23:52 | 08:26:30 | 08:30:00 | 368 | 368 | 319200 | 12-25 | 77 | -334 | 343 | -13.85 | 86.14 | A0 DF P1 |
| 4081210 | 12-Aug-2004 | 08:30:00 | 08:36:54 | 08:44:20 | 860 | 432 | 901632 | 12-25 | 50 | -329 | 333 | -13.52 | 84.38 | A0 DF P1 |
| 4081259 | 12-Aug-2004 | 08:44:20 | 08:44:58 | 08:47:12 | 172 | 80 | 51456 | 6-12 | 50 | -333 | 337 | -13.77 | 84.31 | A0 DF P1 |
| Date | Start | Peak | End | Classification | B [deg] | LCM [deg] |
|---|---|---|---|---|---|---|
| No data |

