move the mouse pointer over that image.
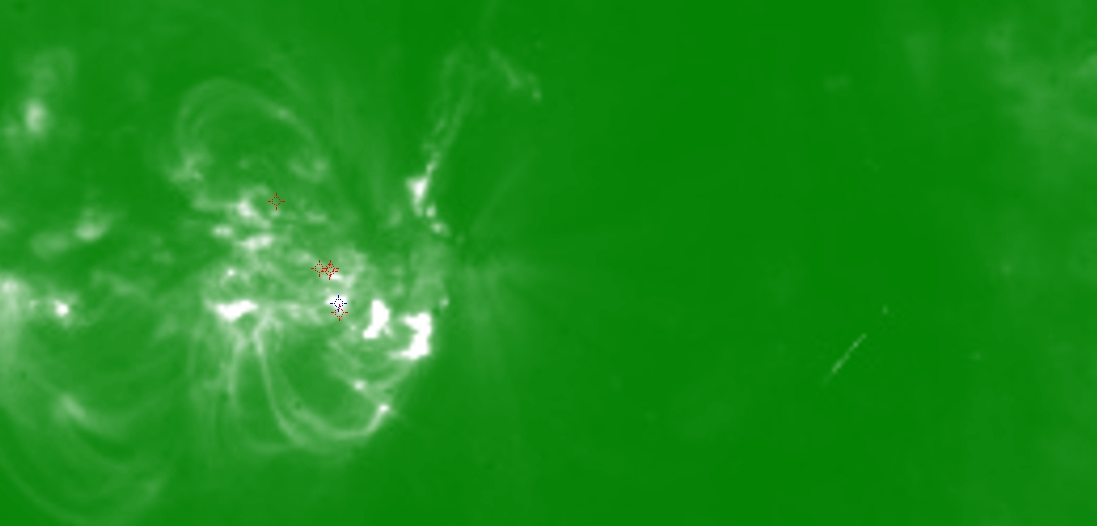
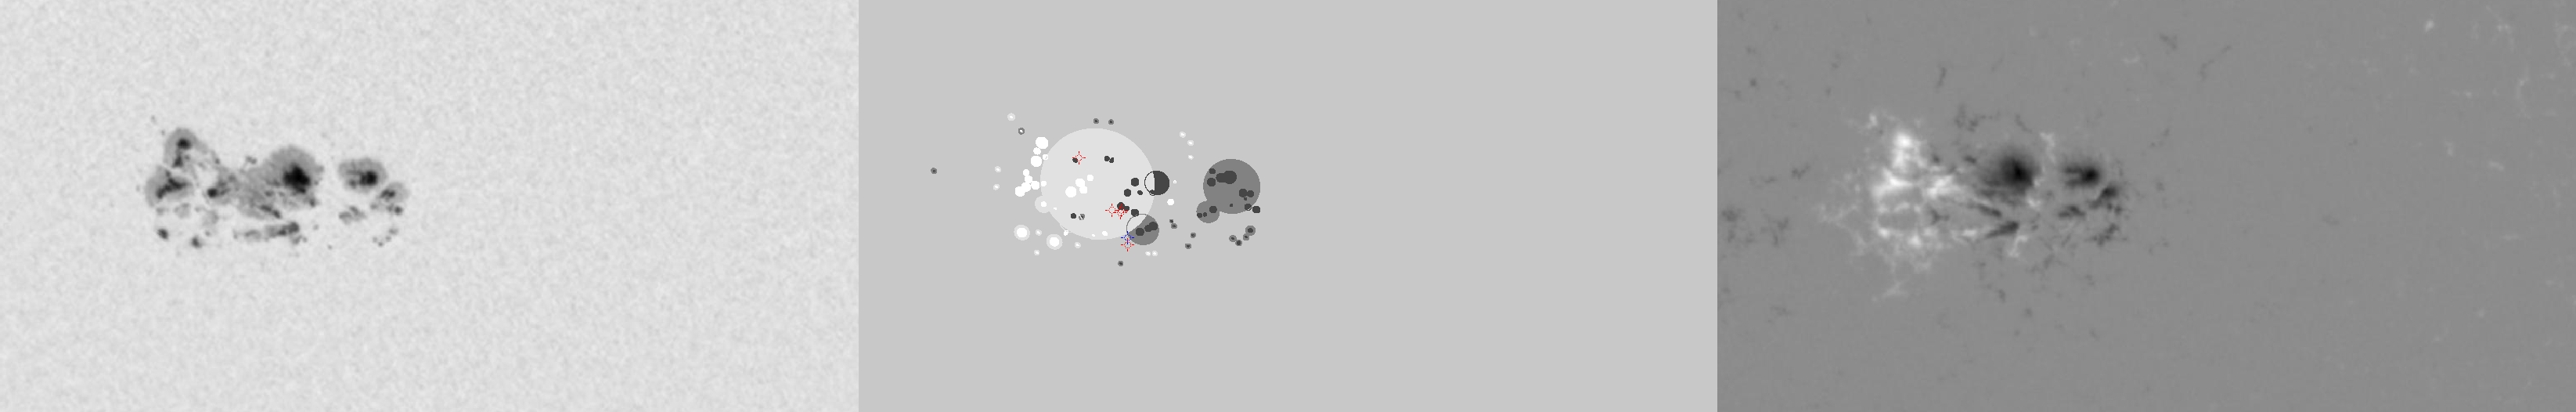
| Evolution of sunspot group NOAA 10656 and positions of flares in it animated by using the data of SOHO/MDI Debrecen Data (SDD) sunspot catalogue (lower panel, middle, ellipses with positions and areas corresponding to the relevant data of spots in SDD and with grey-scale colour coding of the magnetic polarities corresponding to that of the magnetograms), SOHO/MDI continuum images (lower panel, left) and magnetograms (lower panel, right), SOHO/EIT images (upper panel, middle), GOES and RHESSI flare data (red and blue symbols) observed within the interval around the time of SDD data. |
|
When you want to zoom in on one of the images, simply move the mouse pointer over that image. |
 |
| Year | Month | Day | Hour | Min | Sec | NOAA | Proj.U | Proj.WS | Corr.U | Corr.WS | B | L | LCM | Pos.angle | r | MU | MP |
|---|---|---|---|---|---|---|---|---|---|---|---|---|---|---|---|---|---|
| 2004 | 08 | 11 | 10 | 35 | 32 | 10656 | 503 | 3325 | 267 | 1770 | -12.45 | 84.10 | -10.02 | 152.72 | 0.3698 | -345.5 | -71.2 |
| Flare | Date | Start | Peak | End | Dur [s] | Peak [c/s] | Total Counts | Energy [keV] | X pos [asec] | Y pos [asec] | Radial [asec] | B [deg] | L [deg] | Flags |
|---|---|---|---|---|---|---|---|---|---|---|---|---|---|---|
| 4081146 | 11-Aug-2004 | 09:40:20 | 09:43:18 | 09:46:40 | 380 | 14 | 14008 | 12-25 | -202 | -286 | 350 | -11.01 | 81.59 | A0 DF DR P1 |
| 4081173 | 11-Aug-2004 | 09:46:40 | 09:48:06 | 09:49:32 | 172 | 7 | 3132 | 12-25 | -174 | -328 | 372 | -13.61 | 83.17 | A0 DF DR P1 |
| 4081174 | 11-Aug-2004 | 09:52:48 | 09:53:06 | 09:54:36 | 108 | 1 | 470 | 6-12 | -166 | -330 | 369 | -13.73 | 83.62 | A0 DF P1 |
| 4081165 | 11-Aug-2004 | 10:00:16 | 10:02:10 | 10:03:16 | 180 | 1 | 998 | 6-12 | -163 | -328 | 366 | -13.60 | 83.73 | A0 DF P1 |
| 4081175 | 11-Aug-2004 | 10:03:16 | 10:13:50 | 10:30:08 | 1612 | 36 | 89931 | 12-25 | -154 | -356 | 388 | -15.37 | 84.10 | a0 A1 DF P1 |
| Date | Start | Peak | End | Classification | B [deg] | LCM [deg] |
|---|---|---|---|---|---|---|
| 11-Aug-2004 | 10:09 | 10:15 | 10:40 | C4.2 | -15 | -10 |

