move the mouse pointer over that image.
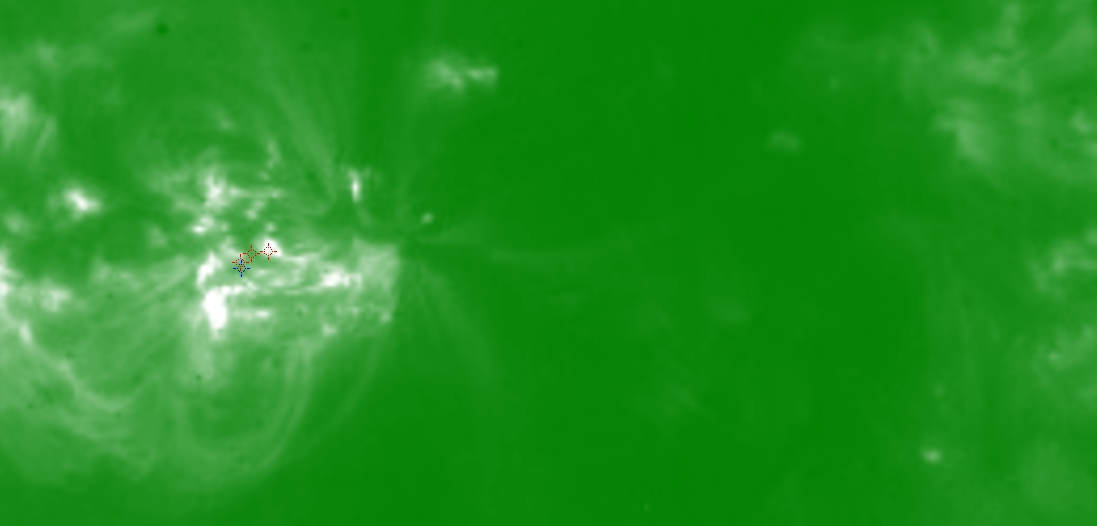
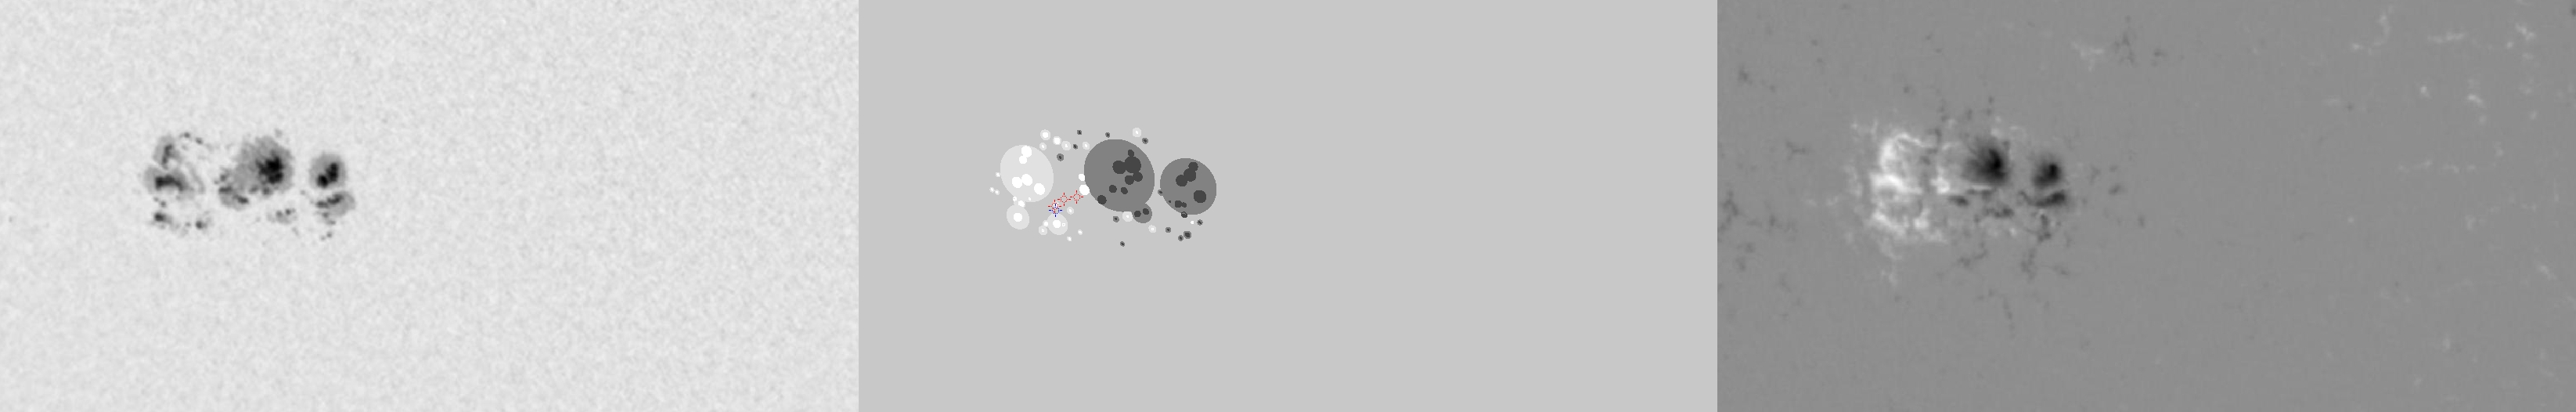
| Evolution of sunspot group NOAA 10656 and positions of flares in it animated by using the data of SOHO/MDI Debrecen Data (SDD) sunspot catalogue (lower panel, middle, ellipses with positions and areas corresponding to the relevant data of spots in SDD and with grey-scale colour coding of the magnetic polarities corresponding to that of the magnetograms), SOHO/MDI continuum images (lower panel, left) and magnetograms (lower panel, right), SOHO/EIT images (upper panel, middle), GOES and RHESSI flare data (red and blue symbols) observed within the interval around the time of SDD data. |
|
When you want to zoom in on one of the images, simply move the mouse pointer over that image. |
 |
| Year | Month | Day | Hour | Min | Sec | NOAA | Proj.U | Proj.WS | Corr.U | Corr.WS | B | L | LCM | Pos.angle | r | MU | MP |
|---|---|---|---|---|---|---|---|---|---|---|---|---|---|---|---|---|---|
| 2004 | 08 | 10 | 09 | 49 | 32 | 10656 | 386 | 2366 | 220 | 1361 | -12.42 | 83.98 | -23.78 | 128.79 | 0.5057 | -458.4 | -18.8 |
| Flare | Date | Start | Peak | End | Dur [s] | Peak [c/s] | Total Counts | Energy [keV] | X pos [asec] | Y pos [asec] | Radial [asec] | B [deg] | L [deg] | Flags |
|---|---|---|---|---|---|---|---|---|---|---|---|---|---|---|
| 4081055 | 10-Aug-2004 | 09:38:24 | 09:43:26 | 09:48:28 | 604 | 24 | 38496 | 6-12 | -410 | -321 | 522 | -13.78 | 81.14 | A0 DF GS P1 |
| 4081056 | 10-Aug-2004 | 09:50:52 | 09:51:58 | 09:55:12 | 260 | 46 | 33432 | 6-12 | -390 | -314 | 501 | -13.27 | 82.47 | A0 DF P1 |
| 4081057 | 10-Aug-2004 | 10:19:24 | 10:22:58 | 10:26:16 | 412 | 24 | 34872 | 6-12 | -392 | -316 | 503 | -13.40 | 82.04 | A0 DF P1 |
| Date | Start | Peak | End | Classification | B [deg] | LCM [deg] |
|---|---|---|---|---|---|---|
| 10-Aug-2004 | 08:51 | 08:58 | 09:02 | B6.2 | -14 | -27 |

