move the mouse pointer over that image.
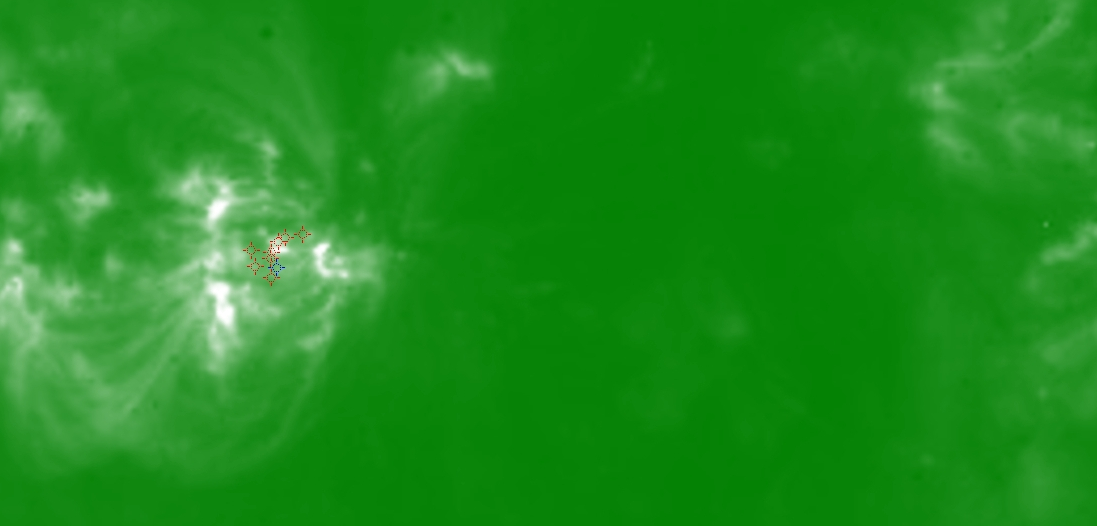
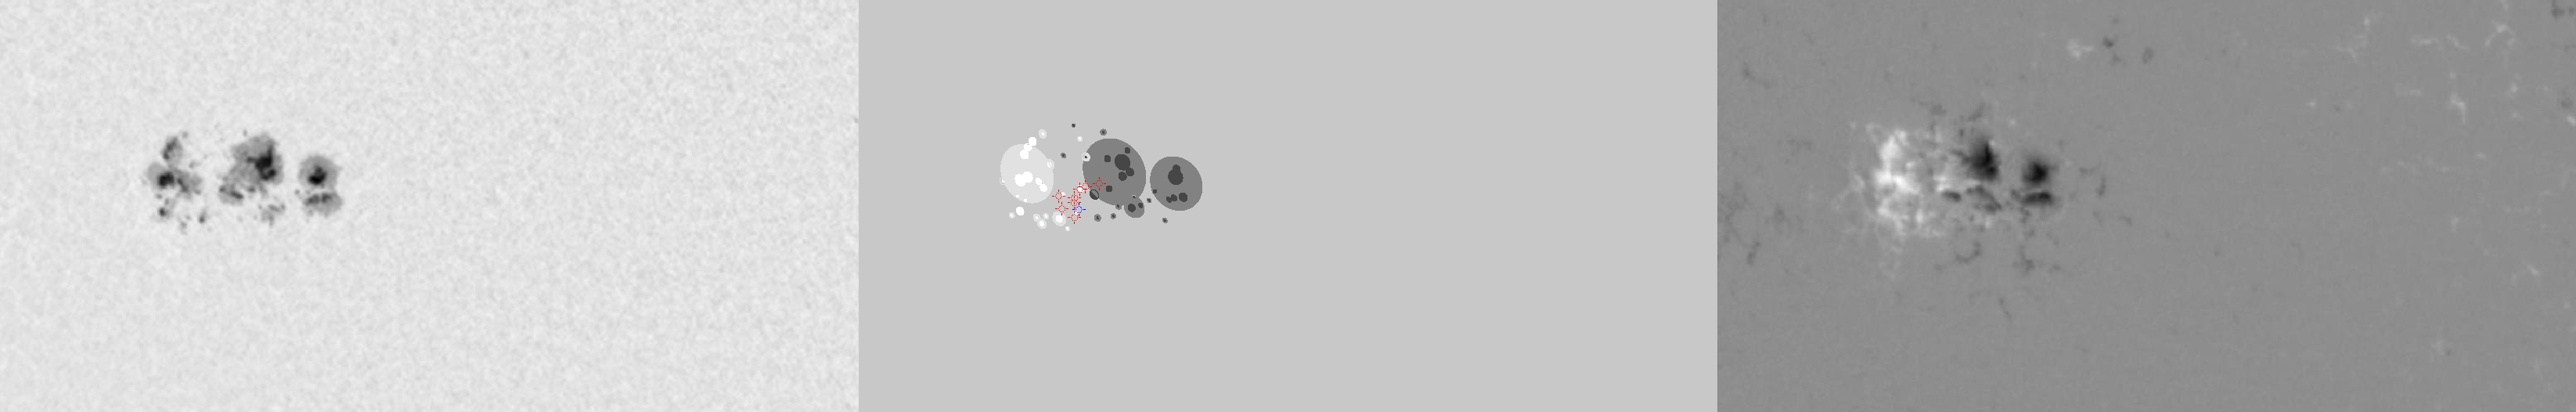
| Evolution of sunspot group NOAA 10656 and positions of flares in it animated by using the data of SOHO/MDI Debrecen Data (SDD) sunspot catalogue (lower panel, middle, ellipses with positions and areas corresponding to the relevant data of spots in SDD and with grey-scale colour coding of the magnetic polarities corresponding to that of the magnetograms), SOHO/MDI continuum images (lower panel, left) and magnetograms (lower panel, right), SOHO/EIT images (upper panel, middle), GOES and RHESSI flare data (red and blue symbols) observed within the interval around the time of SDD data. |
|
When you want to zoom in on one of the images, simply move the mouse pointer over that image. |
 |
| Year | Month | Day | Hour | Min | Sec | NOAA | Proj.U | Proj.WS | Corr.U | Corr.WS | B | L | LCM | Pos.angle | r | MU | MP |
|---|---|---|---|---|---|---|---|---|---|---|---|---|---|---|---|---|---|
| 2004 | 08 | 10 | 01 | 35 | 32 | 10656 | 287 | 1955 | 169 | 1171 | -12.30 | 83.90 | -28.40 | 123.66 | 0.5592 | -389.6 | -36.4 |
| Flare | Date | Start | Peak | End | Dur [s] | Peak [c/s] | Total Counts | Energy [keV] | X pos [asec] | Y pos [asec] | Radial [asec] | B [deg] | L [deg] | Flags |
|---|---|---|---|---|---|---|---|---|---|---|---|---|---|---|
| 4081090 | 10-Aug-2004 | 00:46:44 | 00:47:50 | 00:49:08 | 144 | 10 | 6936 | 6-12 | -470 | -327 | 573 | -14.42 | 81.79 | A0 DF P1 |
| 4081031 | 10-Aug-2004 | 01:28:32 | 01:33:58 | 01:37:16 | 524 | 40 | 49320 | 6-12 | -458 | -312 | 554 | -13.41 | 82.36 | A0 DF P1 |
| 4081091 | 10-Aug-2004 | 01:37:16 | 01:38:34 | 01:40:48 | 212 | 14 | 14712 | 6-12 | -467 | -321 | 566 | -14.02 | 81.60 | A0 DF P1 |
| 4081032 | 10-Aug-2004 | 01:40:48 | 01:43:22 | 01:47:56 | 428 | 16 | 25296 | 6-12 | -456 | -316 | 555 | -13.65 | 82.38 | A0 DF P1 |
| 4081092 | 10-Aug-2004 | 01:47:56 | 01:50:30 | 01:58:08 | 612 | 18 | 30912 | 6-12 | -445 | -303 | 538 | -12.79 | 83.19 | A0 DF P1 |
| 4081001 | 10-Aug-2004 | 01:59:44 | 02:00:34 | 02:02:32 | 168 | 38 | 14160 | 12-25 | -464 | -311 | 559 | -13.37 | 81.70 | A0 DF P1 |
| 4081002 | 10-Aug-2004 | 02:09:28 | 02:13:26 | 02:17:44 | 496 | 208 | 64440 | 12-25 | -428 | -301 | 523 | -12.60 | 84.18 | A0 DF DR P1 |
| 4081035 | 10-Aug-2004 | 02:17:44 | 02:23:02 | 02:28:56 | 672 | 15 | 35616 | 6-12 | -441 | -306 | 538 | -12.96 | 83.15 | A0 DF P1 |
| Date | Start | Peak | End | Classification | B [deg] | LCM [deg] |
|---|---|---|---|---|---|---|
| 10-Aug-2004 | 01:05 | 01:11 | 01:22 | B7.7 | -14 | -30 |

