move the mouse pointer over that image.
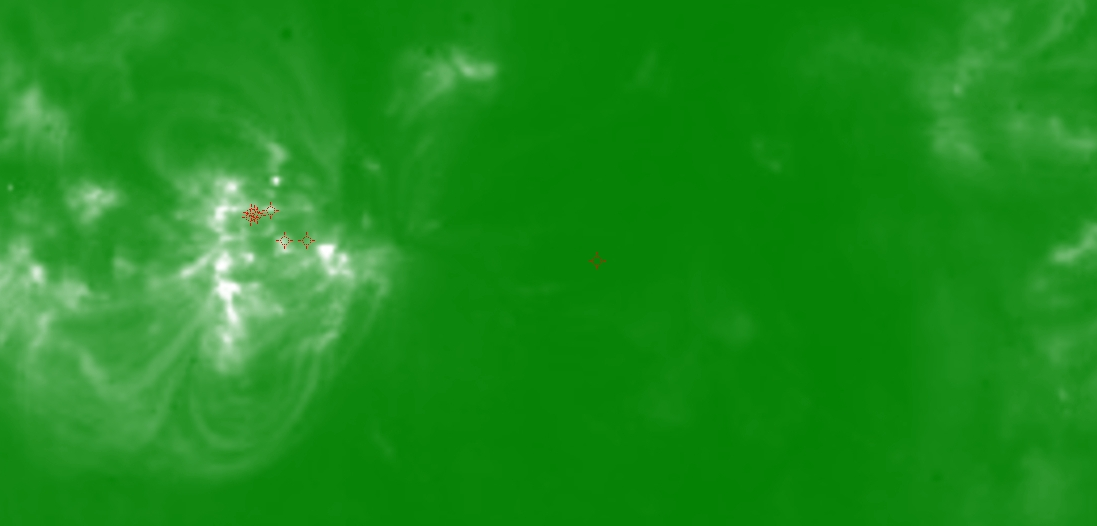
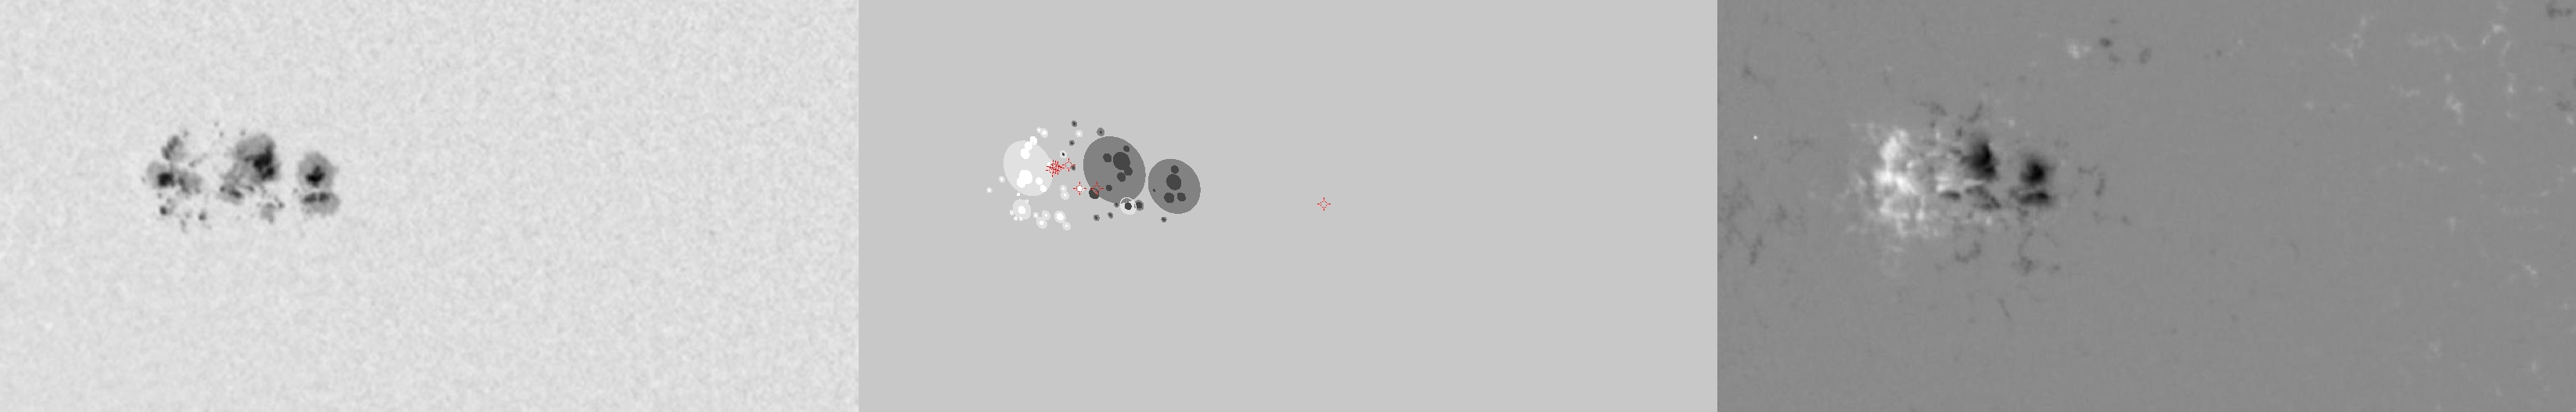
| Evolution of sunspot group NOAA 10656 and positions of flares in it animated by using the data of SOHO/MDI Debrecen Data (SDD) sunspot catalogue (lower panel, middle, ellipses with positions and areas corresponding to the relevant data of spots in SDD and with grey-scale colour coding of the magnetic polarities corresponding to that of the magnetograms), SOHO/MDI continuum images (lower panel, left) and magnetograms (lower panel, right), SOHO/EIT images (upper panel, middle), GOES and RHESSI flare data (red and blue symbols) observed within the interval around the time of SDD data. |
|
When you want to zoom in on one of the images, simply move the mouse pointer over that image. |
 |
| Year | Month | Day | Hour | Min | Sec | NOAA | Proj.U | Proj.WS | Corr.U | Corr.WS | B | L | LCM | Pos.angle | r | MU | MP |
|---|---|---|---|---|---|---|---|---|---|---|---|---|---|---|---|---|---|
| 2004 | 08 | 09 | 23 | 59 | 32 | 10656 | 309 | 1942 | 185 | 1169 | -12.28 | 83.84 | -29.34 | 122.76 | 0.5703 | -429.0 | -8.3 |
| Flare | Date | Start | Peak | End | Dur [s] | Peak [c/s] | Total Counts | Energy [keV] | X pos [asec] | Y pos [asec] | Radial [asec] | B [deg] | L [deg] | Flags |
|---|---|---|---|---|---|---|---|---|---|---|---|---|---|---|
| 4080963 | 9-Aug-2004 | 23:12:48 | 23:14:26 | 23:16:20 | 212 | 208 | 127536 | 12-25 | -464 | -303 | 554 | -12.87 | 83.29 | A0 DF GE P1 PE |
| 40809118 | 9-Aug-2004 | 23:58:04 | 23:58:42 | 00:01:12 | 188 | 14 | 11352 | 6-12 | -488 | -289 | 567 | -12.08 | 81.29 | A0 DF P1 |
| 4081025 | 10-Aug-2004 | 00:01:12 | 00:02:54 | 00:05:16 | 244 | 38 | 23736 | 6-12 | -474 | -285 | 553 | -11.77 | 82.28 | A0 DF P1 |
| 4081026 | 10-Aug-2004 | 00:05:16 | 00:07:58 | 00:09:32 | 256 | 60 | 27120 | 6-12 | -464 | -304 | 555 | -12.93 | 82.79 | A0 DF P1 |
| 4081028 | 10-Aug-2004 | 00:09:32 | 00:16:50 | 00:22:12 | 760 | 128 | 259344 | 6-12 | -479 | -288 | 559 | -11.98 | 81.77 | A0 DF P1 |
| 4081089 | 10-Aug-2004 | 00:22:12 | 00:23:54 | 00:29:04 | 412 | 34 | 41208 | 6-12 | -479 | -287 | 558 | -11.92 | 81.72 | A0 DF DR P1 |
| 4081030 | 10-Aug-2004 | 00:29:04 | 00:35:06 | 00:41:00 | 716 | 72 | 93000 | 6-12 | -478 | -287 | 558 | -11.91 | 81.69 | A0 DF DR P1 |
| 4081101 | 10-Aug-2004 | 23:59:00 | 00:05:42 | 00:11:16 | 736 | 240 | 258792 | 12-25 | -269 | -316 | 415 | -13.10 | 95.79 | A0 DF P1 |
| Date | Start | Peak | End | Classification | B [deg] | LCM [deg] |
|---|---|---|---|---|---|---|
| No data |

