move the mouse pointer over that image.
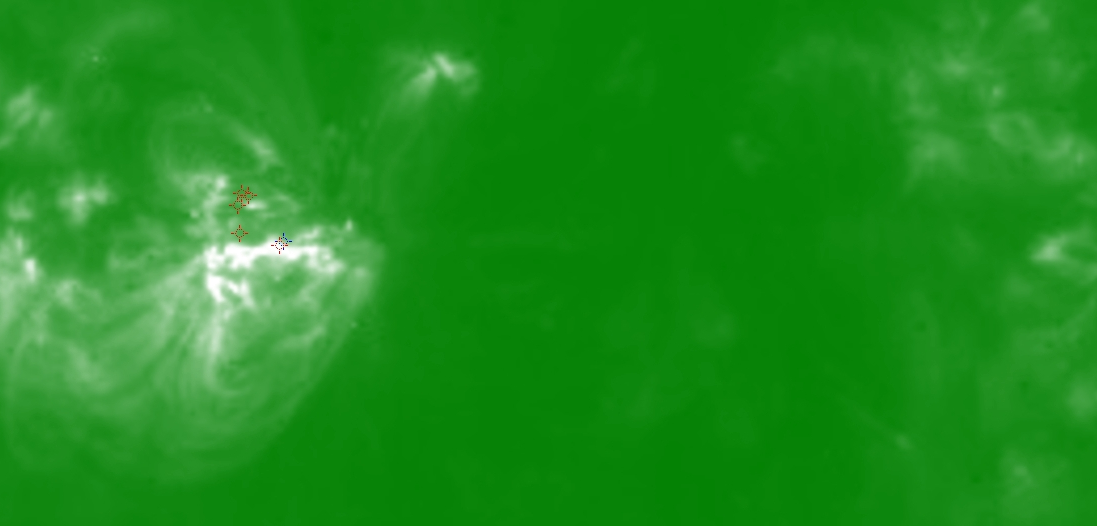
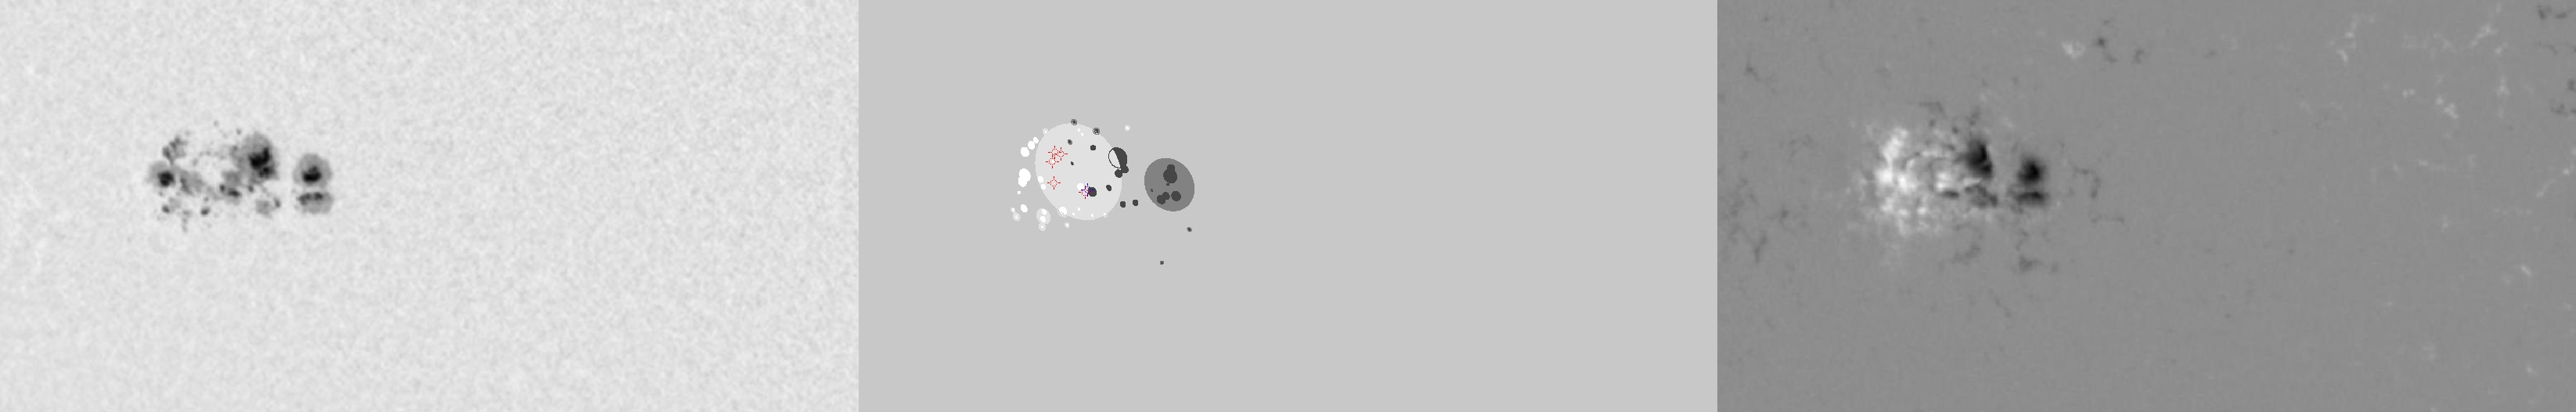
| Evolution of sunspot group NOAA 10656 and positions of flares in it animated by using the data of SOHO/MDI Debrecen Data (SDD) sunspot catalogue (lower panel, middle, ellipses with positions and areas corresponding to the relevant data of spots in SDD and with grey-scale colour coding of the magnetic polarities corresponding to that of the magnetograms), SOHO/MDI continuum images (lower panel, left) and magnetograms (lower panel, right), SOHO/EIT images (upper panel, middle), GOES and RHESSI flare data (red and blue symbols) observed within the interval around the time of SDD data. |
|
When you want to zoom in on one of the images, simply move the mouse pointer over that image. |
 |
| Year | Month | Day | Hour | Min | Sec | NOAA | Proj.U | Proj.WS | Corr.U | Corr.WS | B | L | LCM | Pos.angle | r | MU | MP |
|---|---|---|---|---|---|---|---|---|---|---|---|---|---|---|---|---|---|
| 2004 | 08 | 09 | 20 | 47 | 32 | 10656 | 287 | 2004 | 175 | 1232 | -12.22 | 83.70 | -31.24 | 121.01 | 0.5925 | -497.5 | 22.3 |
| Flare | Date | Start | Peak | End | Dur [s] | Peak [c/s] | Total Counts | Energy [keV] | X pos [asec] | Y pos [asec] | Radial [asec] | B [deg] | L [deg] | Flags |
|---|---|---|---|---|---|---|---|---|---|---|---|---|---|---|
| 40809143 | 9-Aug-2004 | 20:03:00 | 20:05:02 | 20:05:20 | 140 | 37 | 16105 | 12-25 | -497 | -305 | 583 | -13.14 | 82.64 | A0 DF P1 Q2 |
| 40809114 | 9-Aug-2004 | 20:40:28 | 20:45:46 | 20:49:36 | 548 | 42 | 82138 | 6-12 | -513 | -281 | 585 | -11.69 | 81.31 | A0 DF P1 |
| 40809144 | 9-Aug-2004 | 20:49:36 | 20:54:22 | 20:57:44 | 488 | 423 | 286631 | 12-25 | -504 | -275 | 574 | -11.28 | 81.94 | A0 DF P1 |
| 4080935 | 9-Aug-2004 | 20:57:44 | 21:04:18 | 21:13:24 | 940 | 452 | 785394 | 12-25 | -506 | -274 | 575 | -11.22 | 81.71 | A0 DF DR P1 PE |
| 4080936 | 9-Aug-2004 | 21:13:24 | 21:17:38 | 21:18:52 | 328 | 136 | 89369 | 6-12 | -504 | -299 | 586 | -12.79 | 81.52 | a0 A1 DF DR P1 PE |
| Date | Start | Peak | End | Classification | B [deg] | LCM [deg] |
|---|---|---|---|---|---|---|
| 9-Aug-2004 | 20:15 | 20:18 | 20:20 | C2.2 | -13 | -32 |

