move the mouse pointer over that image.
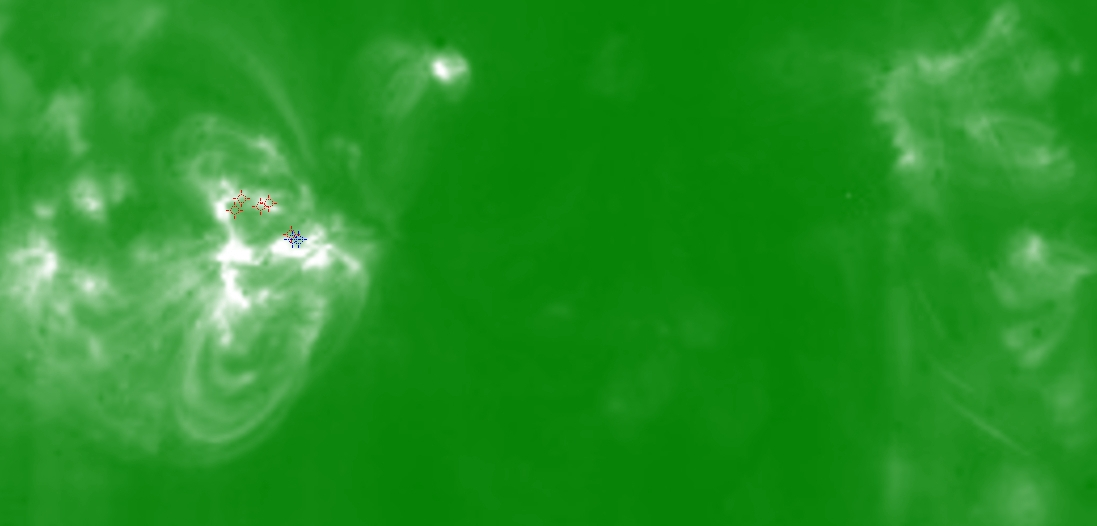
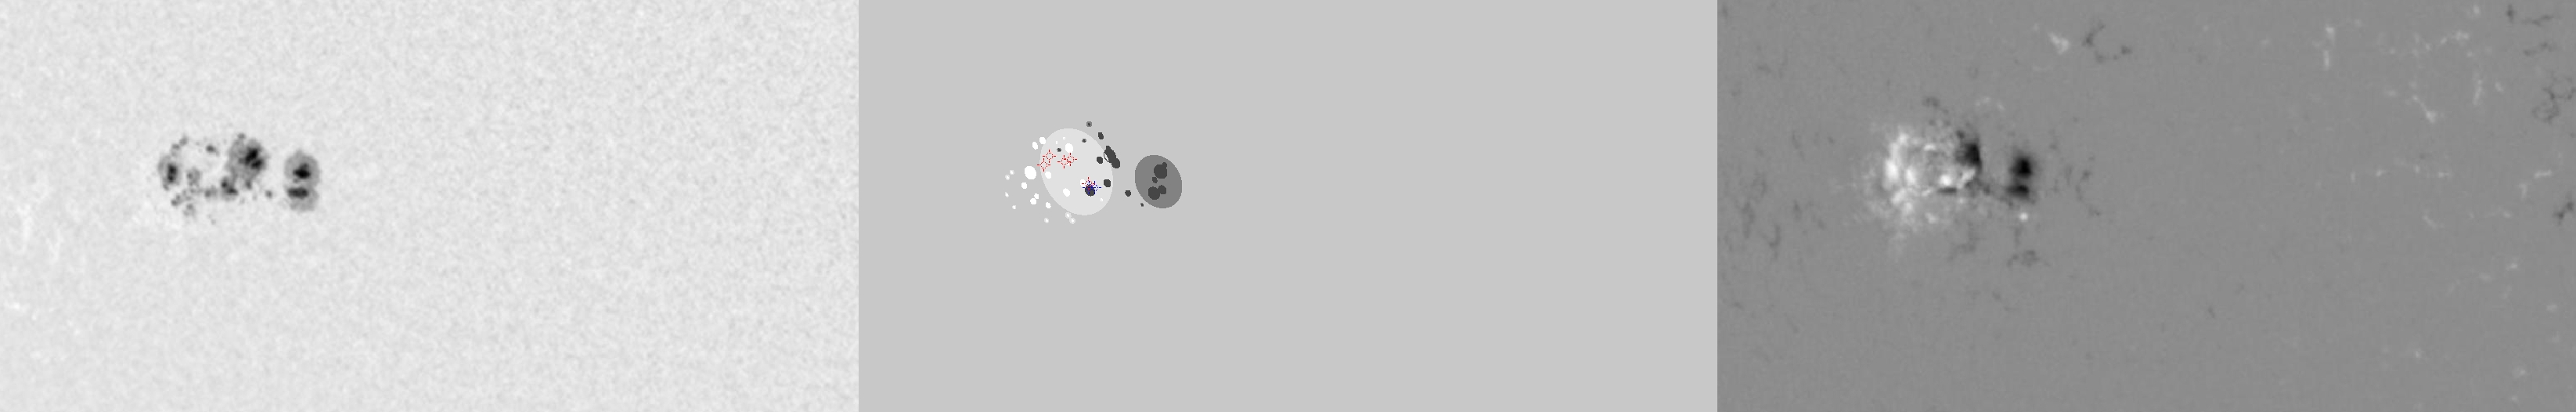
| Evolution of sunspot group NOAA 10656 and positions of flares in it animated by using the data of SOHO/MDI Debrecen Data (SDD) sunspot catalogue (lower panel, middle, ellipses with positions and areas corresponding to the relevant data of spots in SDD and with grey-scale colour coding of the magnetic polarities corresponding to that of the magnetograms), SOHO/MDI continuum images (lower panel, left) and magnetograms (lower panel, right), SOHO/EIT images (upper panel, middle), GOES and RHESSI flare data (red and blue symbols) observed within the interval around the time of SDD data. |
|
When you want to zoom in on one of the images, simply move the mouse pointer over that image. |
 |
| Year | Month | Day | Hour | Min | Sec | NOAA | Proj.U | Proj.WS | Corr.U | Corr.WS | B | L | LCM | Pos.angle | r | MU | MP |
|---|---|---|---|---|---|---|---|---|---|---|---|---|---|---|---|---|---|
| 2004 | 08 | 09 | 11 | 11 | 32 | 10656 | 237 | 1551 | 154 | 1015 | -12.25 | 83.70 | -36.53 | 117.19 | 0.6553 | -378.2 | 25.7 |
| Flare | Date | Start | Peak | End | Dur [s] | Peak [c/s] | Total Counts | Energy [keV] | X pos [asec] | Y pos [asec] | Radial [asec] | B [deg] | L [deg] | Flags |
|---|---|---|---|---|---|---|---|---|---|---|---|---|---|---|
| 4080922 | 9-Aug-2004 | 11:04:16 | 11:06:26 | 11:22:00 | 1064 | 92 | 183410 | 12-25 | -557 | -295 | 630 | -12.81 | 83.20 | a0 A1 DF ES P1 PE |
| 40809132 | 9-Aug-2004 | 11:22:00 | 11:24:02 | 11:35:28 | 808 | 7 | 20256 | 12-25 | -567 | -276 | 631 | -11.66 | 82.46 | A0 DF DR P1 |
| 4080984 | 9-Aug-2004 | 11:35:28 | 11:37:06 | 11:45:12 | 584 | 4 | 4732 | 6-12 | -569 | -278 | 634 | -11.80 | 82.17 | A0 DF P1 |
| 4080985 | 9-Aug-2004 | 11:45:12 | 11:46:46 | 11:48:52 | 220 | 1 | 641 | 6-12 | -583 | -281 | 647 | -12.06 | 80.95 | A0 DF P1 |
| 4080986 | 9-Aug-2004 | 11:48:52 | 11:58:02 | 12:04:48 | 956 | 11 | 12233 | 12-25 | -576 | -274 | 638 | -11.58 | 81.47 | A0 DF P1 |
| Date | Start | Peak | End | Classification | B [deg] | LCM [deg] |
|---|---|---|---|---|---|---|
| 9-Aug-2004 | 10:31 | 10:34 | 10:36 | B9.0 | -13 | -37 |
| 9-Aug-2004 | 11:01 | 11:06 | 11:15 | C1.7 | -13 | -37 |

