move the mouse pointer over that image.
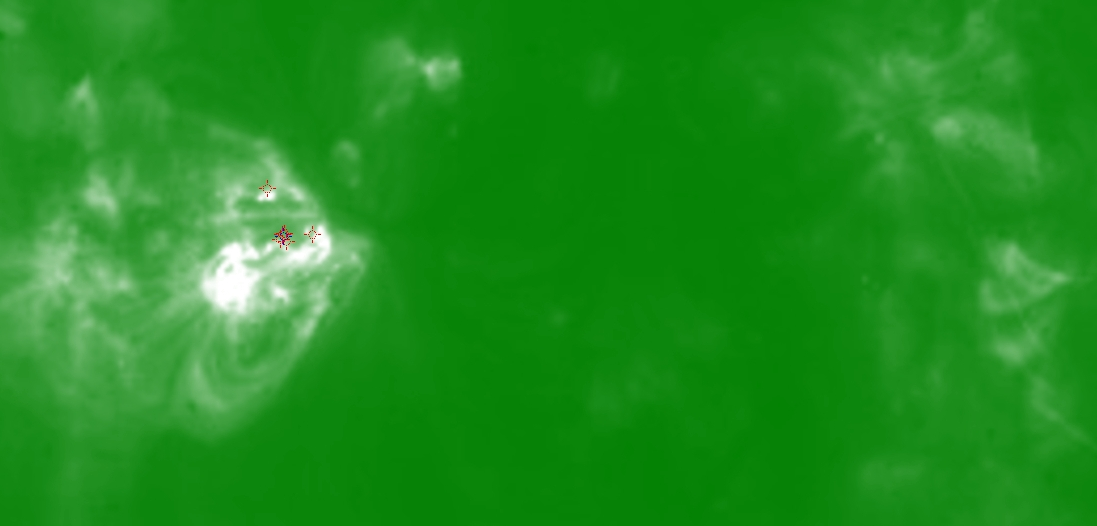
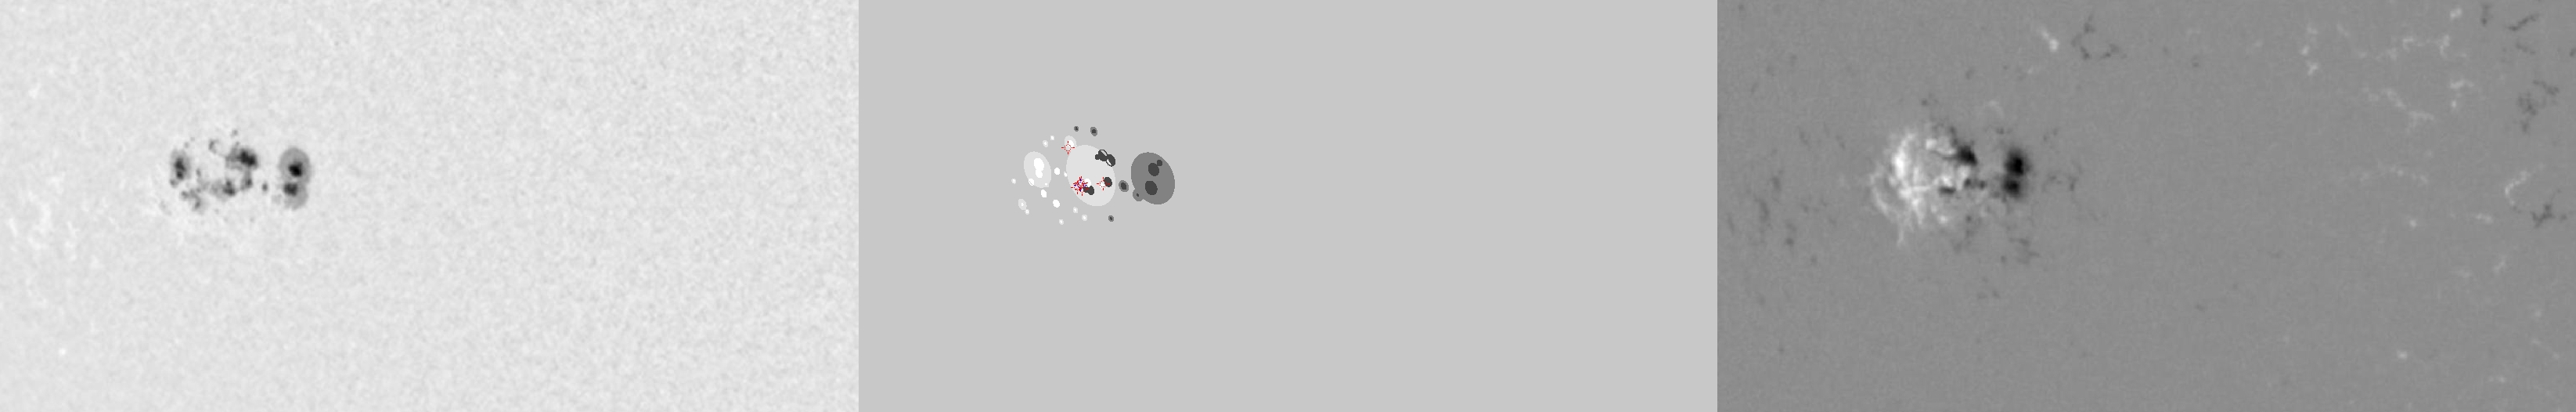
| Evolution of sunspot group NOAA 10656 and positions of flares in it animated by using the data of SOHO/MDI Debrecen Data (SDD) sunspot catalogue (lower panel, middle, ellipses with positions and areas corresponding to the relevant data of spots in SDD and with grey-scale colour coding of the magnetic polarities corresponding to that of the magnetograms), SOHO/MDI continuum images (lower panel, left) and magnetograms (lower panel, right), SOHO/EIT images (upper panel, middle), GOES and RHESSI flare data (red and blue symbols) observed within the interval around the time of SDD data. |
|
When you want to zoom in on one of the images, simply move the mouse pointer over that image. |
 |
| Year | Month | Day | Hour | Min | Sec | NOAA | Proj.U | Proj.WS | Corr.U | Corr.WS | B | L | LCM | Pos.angle | r | MU | MP |
|---|---|---|---|---|---|---|---|---|---|---|---|---|---|---|---|---|---|
| 2004 | 08 | 09 | 03 | 11 | 32 | 10656 | 188 | 1148 | 132 | 802 | -12.38 | 83.84 | -40.79 | 114.85 | 0.7045 | -336.2 | 9.0 |
| Flare | Date | Start | Peak | End | Dur [s] | Peak [c/s] | Total Counts | Energy [keV] | X pos [asec] | Y pos [asec] | Radial [asec] | B [deg] | L [deg] | Flags |
|---|---|---|---|---|---|---|---|---|---|---|---|---|---|---|
| 4080969 | 9-Aug-2004 | 02:21:32 | 02:26:18 | 02:29:20 | 468 | 597 | 520149 | 12-25 | -612 | -290 | 677 | -12.82 | 83.66 | A0 DF P1 |
| 4080970 | 9-Aug-2004 | 03:08:16 | 03:09:10 | 03:11:36 | 200 | 36 | 28848 | 6-12 | -619 | -295 | 686 | -13.18 | 82.63 | A0 DF P1 |
| 4080908 | 9-Aug-2004 | 03:13:48 | 03:17:58 | 03:21:12 | 444 | 592 | 633312 | 12-25 | -618 | -290 | 682 | -12.86 | 82.70 | A0 DF P1 |
| 40809125 | 9-Aug-2004 | 03:21:12 | 03:21:30 | 03:25:36 | 264 | 272 | 252864 | 6-12 | -620 | -294 | 687 | -13.12 | 82.45 | A0 DF P1 |
| 40809126 | 9-Aug-2004 | 03:25:36 | 03:31:46 | 03:36:56 | 680 | 432 | 563376 | 12-25 | -616 | -291 | 681 | -12.91 | 82.72 | A0 DF P1 |
| 4080971 | 9-Aug-2004 | 03:51:12 | 03:52:46 | 03:54:16 | 184 | 22 | 19128 | 6-12 | -621 | -263 | 674 | -11.17 | 82.45 | A0 DF DR P1 |
| Date | Start | Peak | End | Classification | B [deg] | LCM [deg] |
|---|---|---|---|---|---|---|
| 9-Aug-2004 | 03:14 | 03:18 | 03:35 | B7.2 | -13 | -42 |

